Displaced Moving Average Study
By Samantha Baltodano
TL;DR:
The Displaced Moving Average indicator is used to closely match the moving average with the price action. It is used to signal the direction of a trend, and possible support and resistance areas.
What Is the Displaced Moving Average?
A Displaced Moving Average is a study that calculates a Simple Moving Average (SMA) or an Exponential Moving Average (EMA) and displaces it for a predetermined period of time.
The DMA indicator is used to closely match the moving average with the price action.
How to Use the DMA
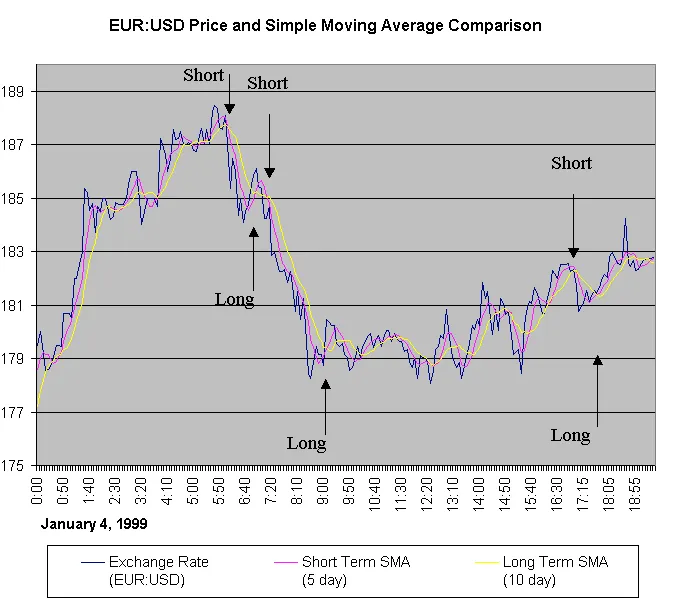
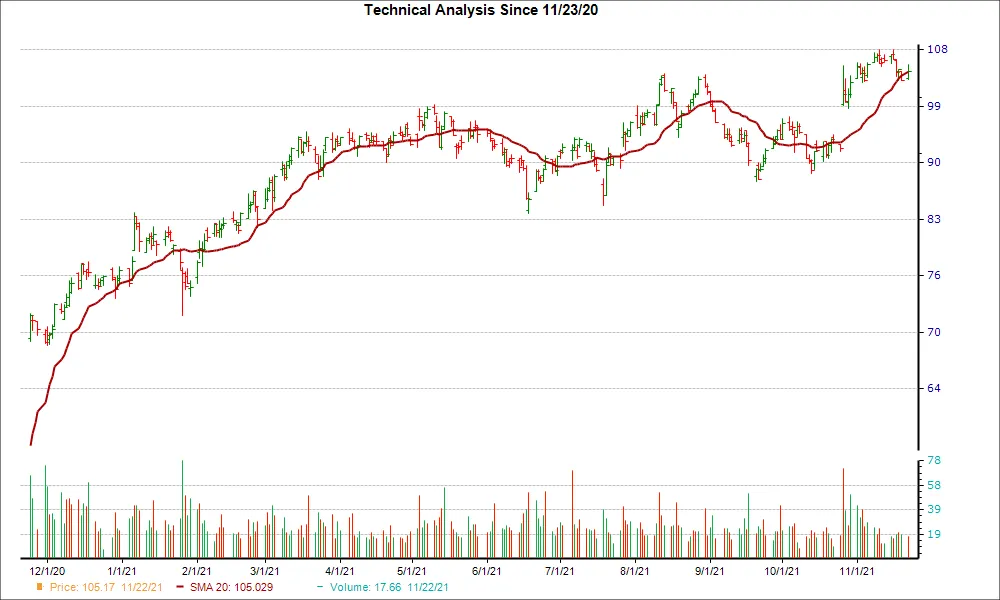
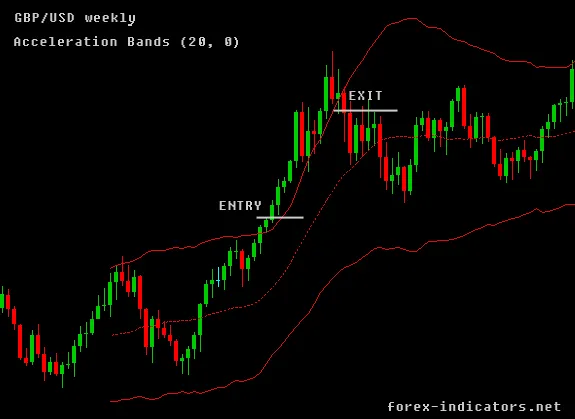
The DMA can be implemented into your trading strategy to find potential price trend directions. For example, when the price of a security crosses above the moving average, this is indicative of an uptrend.
Conversely, a price that crosses below the DMA may be indicative of a trend reversal. When price is below the moving average, it suggests a downtrend, or the beginning of a downtrend.
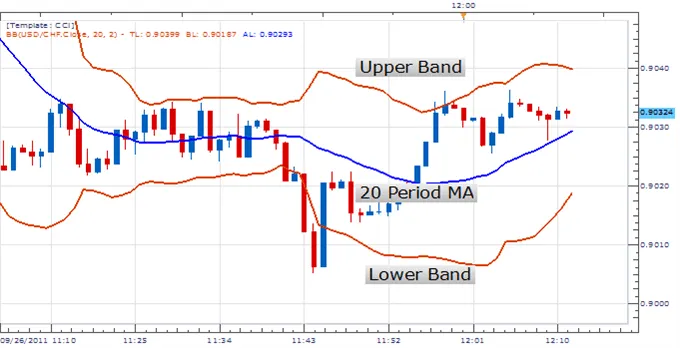
A DMA can also help traders identify areas of support and resistance. For example, in case of an uptrend, the moving average can be aligned with price in a manner that the historical pullback lows are in accordance with the moving average. When the price nears the moving average, it is indicative that the moving average may offer support.
Similarly, in the case of a downtrend, the DMA is adjusted to be at par with the pullback highs. On pullbacks ahead, a trader may examine if the DMA offers resistance. In case it does, the price may offer a short trading window for traders, which is the DMA trading strategy.
Limitations
As with many technical analysis indicators, a DMA is not always reliable for trend reversals or support and resistance levels. This indicator does not necessarily have any predictive calculations embedded into it, therefore its forecasting accuracy is limited.
Calculations
To calculate a DMA, first calculate an EMA or SMA.
Then, move the moving average to the left or to the right over a fixed number of periods.
A move to the right will drag the moving average down so that the DMA will be calculated several periods ahead of the correlating bar or candle.
A move to the left will advance the moving average, with the DMA being calculated several periods after the correlating bar or Doji candle.
Summary
- The DMA is valuable for identifying trend direction and areas of support and resistance.
- The DMA indicator is used to closely match the moving average with the price action.
- To use the DMA, first calculate an EMA or SMA, then simply move the line forward or backward in time.
- This indicator does not necessarily have any predictive calculations embedded into it, therefore its forecasting accuracy is limited.
Displaced Moving Average is just one of many studies that Archaide automates. For a full list of strategies and studies available click here.
Like what you read? Check out the rest of our content!


