Moving Average Strategy
By Samantha Baltodano
TL;DR
Moving averages are the average price of a security over a given number of days.
What Are Moving Averages?
The moving average is the average price of a security over a given period of time. Moving averages are used to identify trends in price fluctuations, smoothing out the noise and short lived spikes for individual securities and indexes.
Types of Moving Averages
There are many variations of the moving average strategy. Simple moving averages and exponential moving averages are the most common.
Simple moving averages find the average price over a given period of time. For example, the 20-day moving average line plots the average price over a 20-day period.
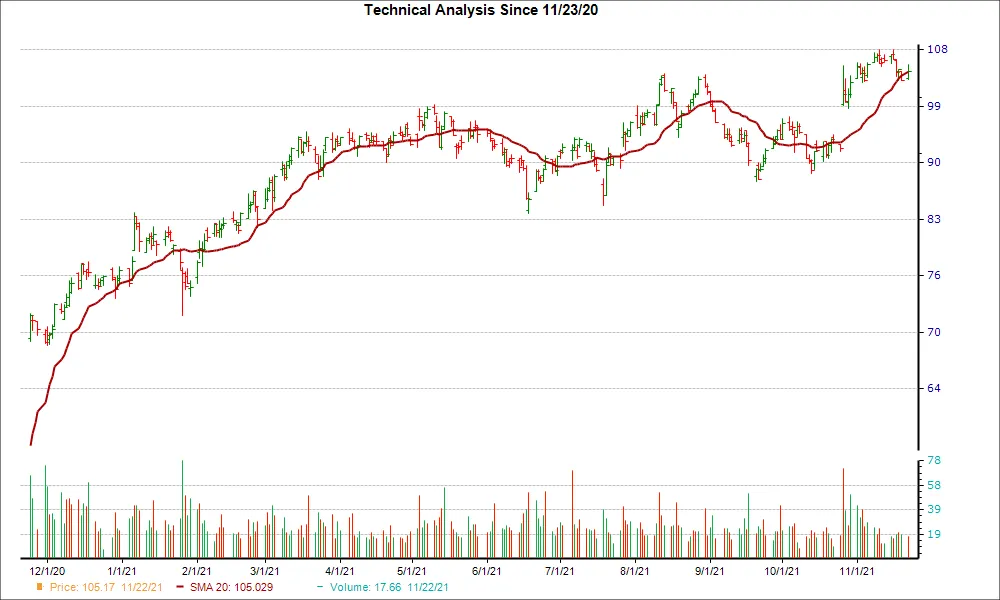
Source: nasdaq.com (2021)
Figure 1: 20-day simple moving average line
The exponential moving average is weighted and favors the more recent price changes.
Other options include the Wilders or Hull.
Additionally, you can also calculate your averages using closing price, opening price, high price, low price, or a calculation combining various price levels.
How do you use moving averages?
The 50-day, 100-day, and 200-day moving averages are the most common for identifying long term support and resistance levels and overall trends. These are considered less susceptible to short term price fluctuations.
The shorter moving averages (5, 10, 20, 50-day) are often used to identify near term trend changes. These can be early indicators of longer term trends.
When do you buy and sell with a MA strategy?
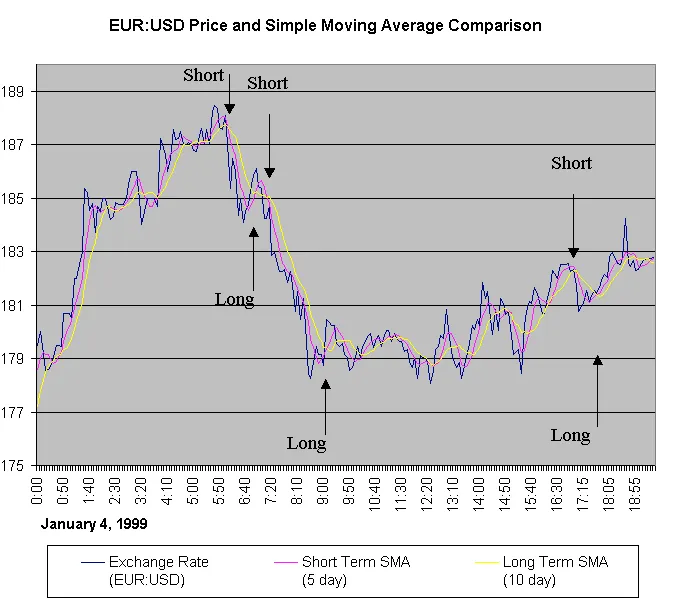
With moving averages, you’ll buy and sell as the moving average crosses price. There are two methods for trading with this strategy: trend following and reversal.
Trend following:
- Sell when price falls below the moving average
- Buy as price crosses above the moving average
For reversal, the opposite is true:
- Buy when price falls below the moving average
- Sell as price crosses above the moving average
Summary
- Moving averages are one of the most commonly used technical indicators.
- It is the average price of a security over a given period of time.
- There are different types of moving averages and different ways to calculate them. The time periods are also variable. These differences will reveal different information about a security.
- Moving average buy and sell indicators can be set by trend following or reversal. Trend following is more commonly used.
Moving Average is one of many strategies that Archaide automates. For a full list of strategies and studies available click here.
Like what you read? Check out the rest of our content!
