Simple Moving Average Study
By Timothy Yslava
Reviewed by Samantha Baltodano
TL;DR:
The Simple Moving Average (SMA) is the average stock price over time which could be used as an indicator of a given security’s price trend.
What Is the Simple Moving Average?
The SMA is a technical indicator in the moving average family that helps you identify price trends for a given security.
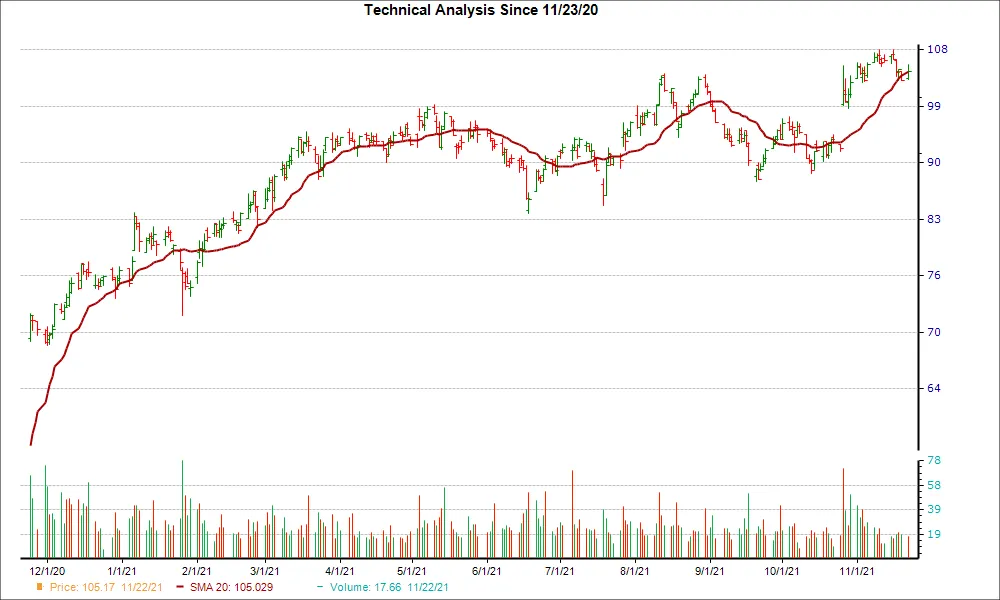
Source: Investopedia (2022)
Figure 1: 50-day simple moving average
The SMA is the average stock price over time. For example, the 10-day SMA is calculated by summing the close price, opening price, high price, low price, or a calculation combining various price levels of a security for the last 10 days and then dividing this total by 10.
As days pass, the moving average may slope in a given direction and therein indicate a trend. The steepness of the slope could indicate the trend’s strength.
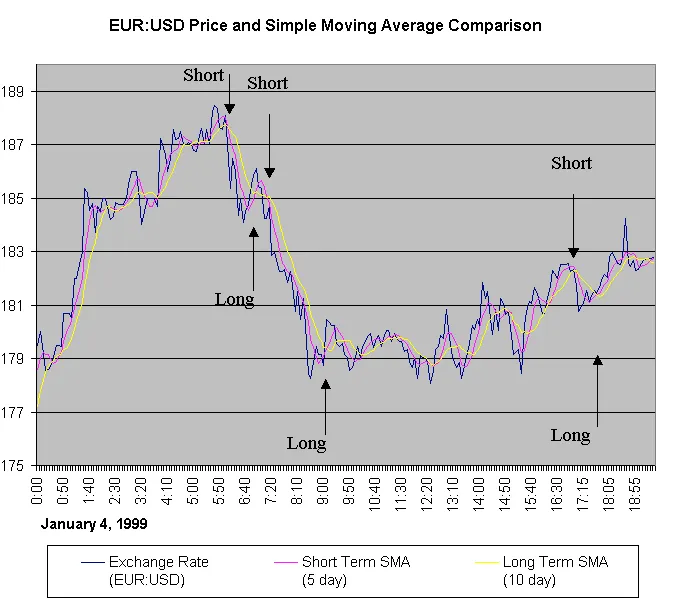
A popular analysis technique that is used with moving averages is looking for price breakouts: crossovers of the price plot with the moving average. Bullish breakouts are indicated every time the price crosses above the average. When the price falls below the average, a bearish breakout is recognized.
Note that since the SMA gives equal weight to each daily price, recent market volatility may appear smoothed out. Long-term SMAs tend to ignore minor fluctuations and only acknowledge longer-term trends. Likewise, shorter-term moving averages may show shorter-term trends, but tend to ignore long-term ones.
How do you use the simple moving average?
The 50-day, 100-day, and 200-day simple moving averages are the most common for identifying long term support and resistance levels and overall trends. These are considered less susceptible to short term price fluctuations.
The shorter simple moving averages (5, 10, 20, 50-day) are often used to identify near term trend changes. These can be early indicators of longer term trends.
When do you buy and sell with a SMA strategy?
With moving averages, you’ll buy and sell as the moving average crosses price. There are two methods for trading with this strategy: trend following and reversal.
Common entry points:
- When a security’s price rises above the SMA
- When a security’s price falls and bounces off of the SMA
Common exit points:
- When a security’s price falls below the SMA
- When a security’s price rises bounces off of the SMA
Summary
- Simple moving averages are one of the most commonly used technical indicators.
- It is the average price of a security over a given period of time.
- Simple moving average buy and sell indicators can be set by trend following or reversal. Trend following is more commonly used.
The Simple Moving Average is just one of many studies that Archaide automates. For a full list of strategies and studies available click here.
Like what you read? Check out the rest of our content!


