


Simple ROC Strategy
TL;DR: The Simple ROC strategy is a technical analysis tool that uses the rate of change of two-bar price momentum to identify potential buy and sell signals in the market.
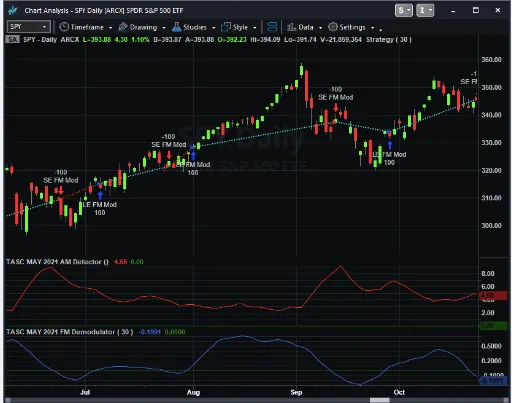
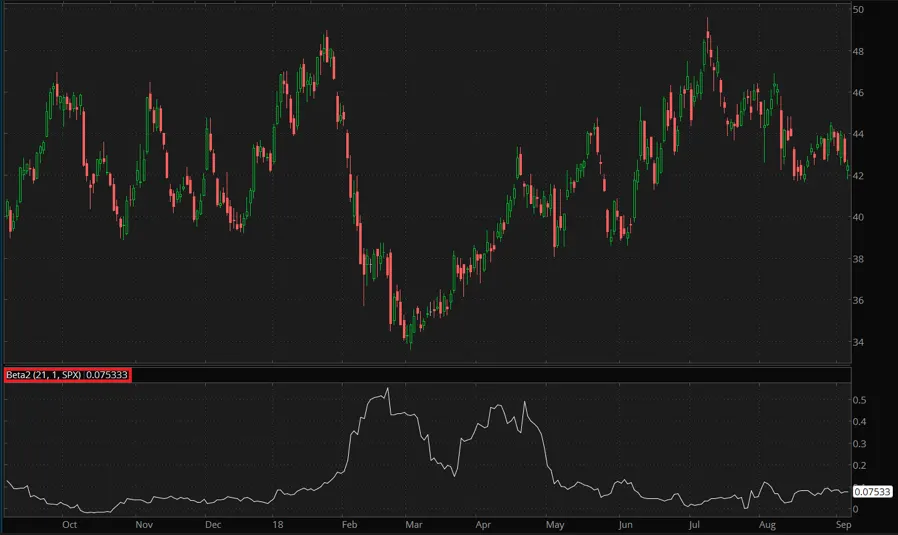
FM Demodulator 2 Study
TL;DR: The FM Demodulator 2 is a technical analysis tool used to detect potential turning points in market data.
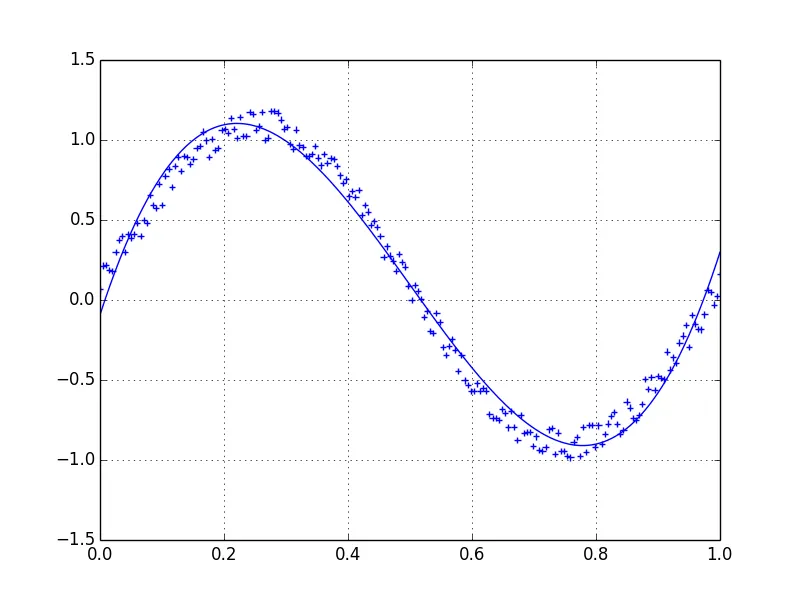
FM Demodulator Study
TL;DR: The FM Demodulator study is a tool that uses signal processing to help traders analyze market data and detect potential turning points.
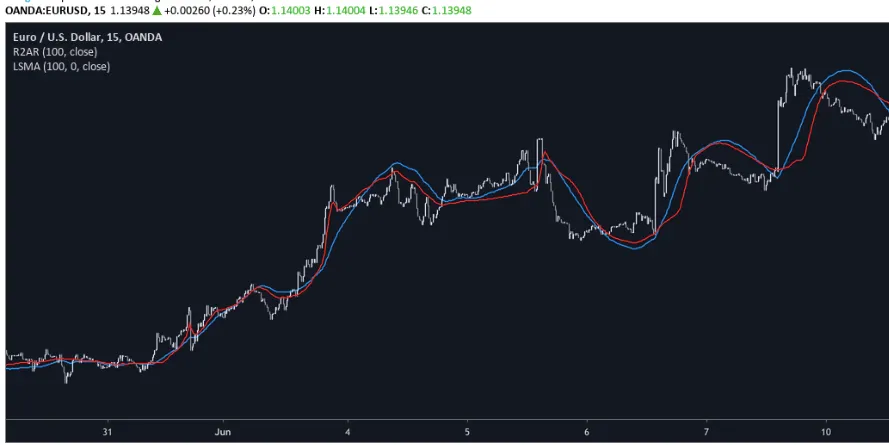
R2 Trend Strategy
TL;DR: The R2 Trend strategy is a trading strategy that uses the R-Squared technical indicator to identify trending conditions.
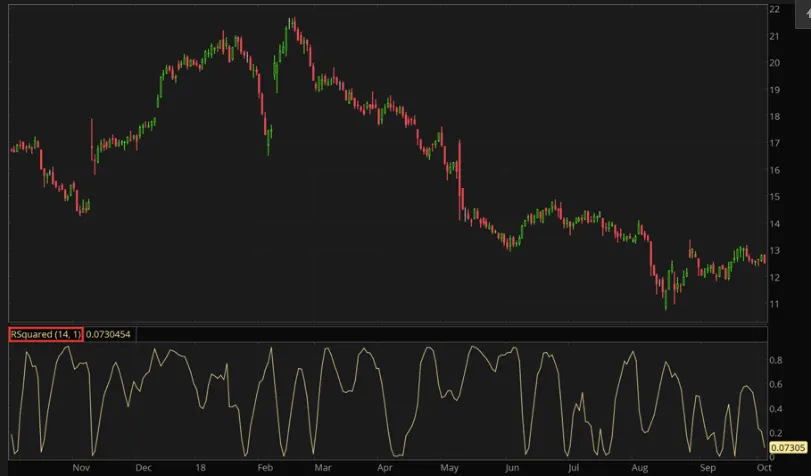
R-Squared Study
TL;DR: The R-Squared (R2) is a technical indicator used by traders to determine the correlation between real data points and a linear regression trendline.
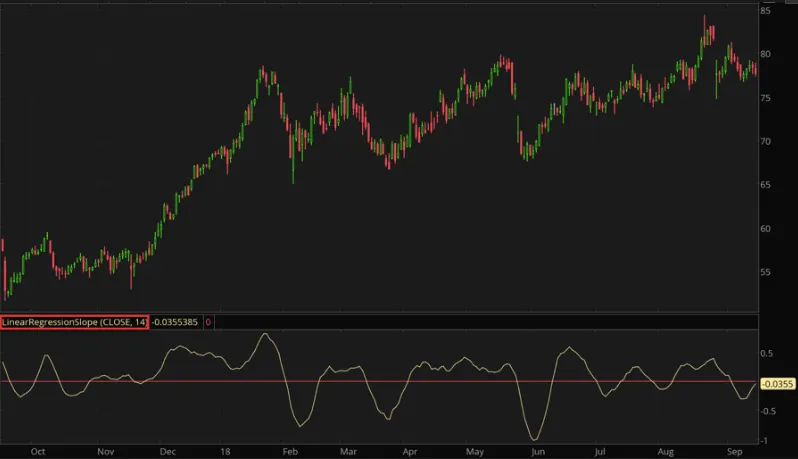
Linear Regression Slope Study
TL;DR: The Linear Regression Slope study is a tool used by traders to predict the future price of a security.
Price Swing Strategy
TL;DR: The Price Swing strategy is a swing trading technical indicator that can help traders identify buy and sell points for trades.
Mean Reversion Swing Strategy
TL;DR: The Mean Reversion Swing strategy is a swing trading method that uses a specific pattern in the stock market called mean reversion sequence to identify potential buying opportunities.
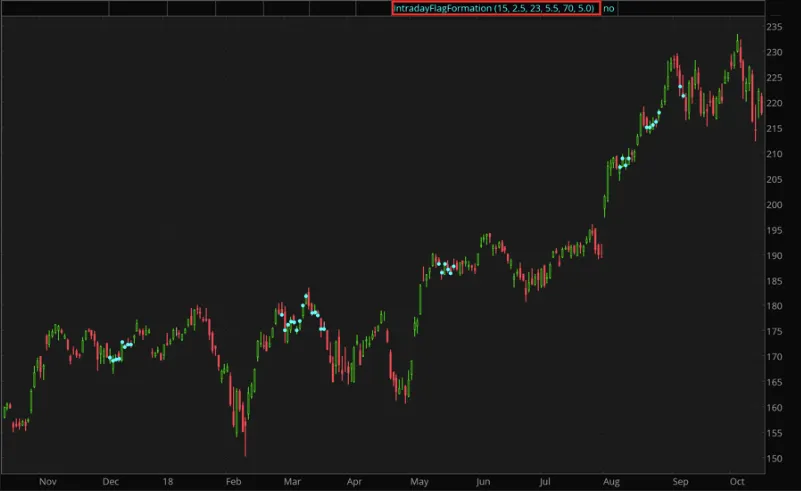
Intraday Flag Formation Strategy
TL;DR: The Intraday Flag Formation strategy helps traders identify and trade a pattern called a Flag on intraday charts.
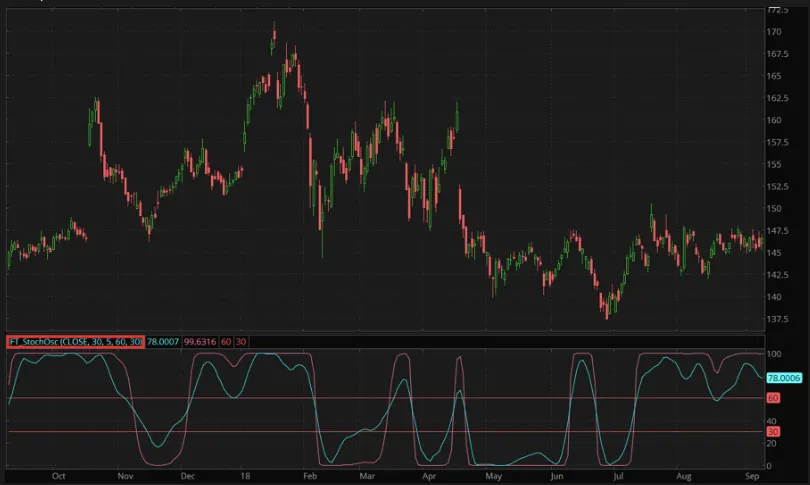
IFT Stochastic Oscillator Strategy
TL;DR: The IFT Stochastic Oscillator strategy is a tool used in trading to identify buying and selling opportunities in the market, which combines the
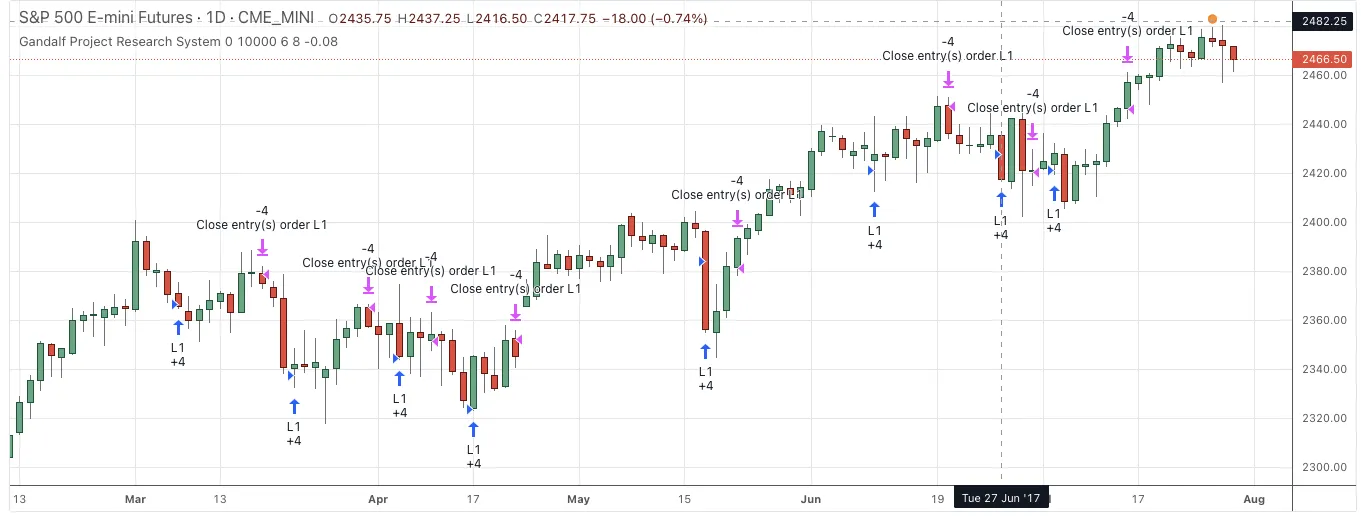
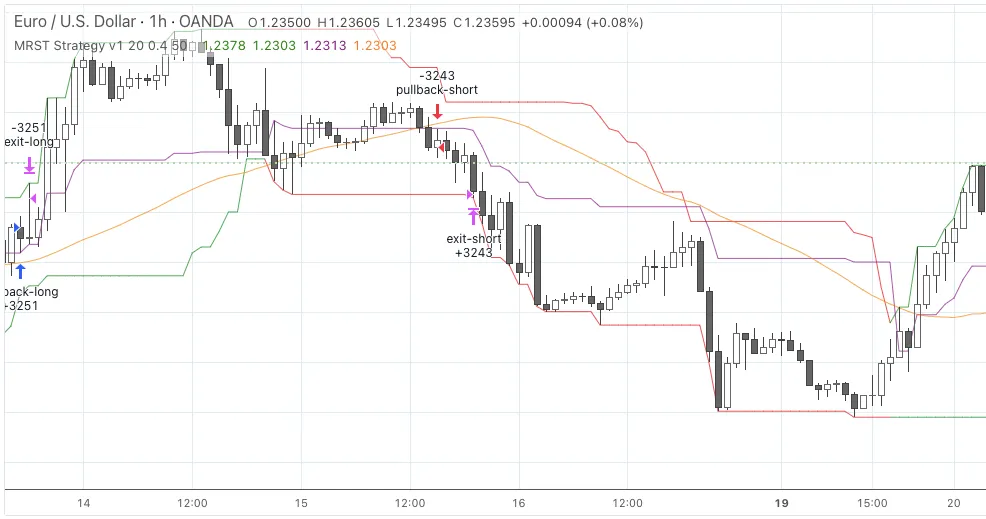
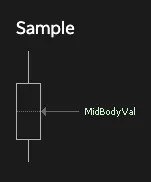
Gandalf Project Research System Strategy
TL;DR: The Gandalf Project Research System is a trading strategy that uses data like the candle average price, median price, and mid-body value to identify points of...
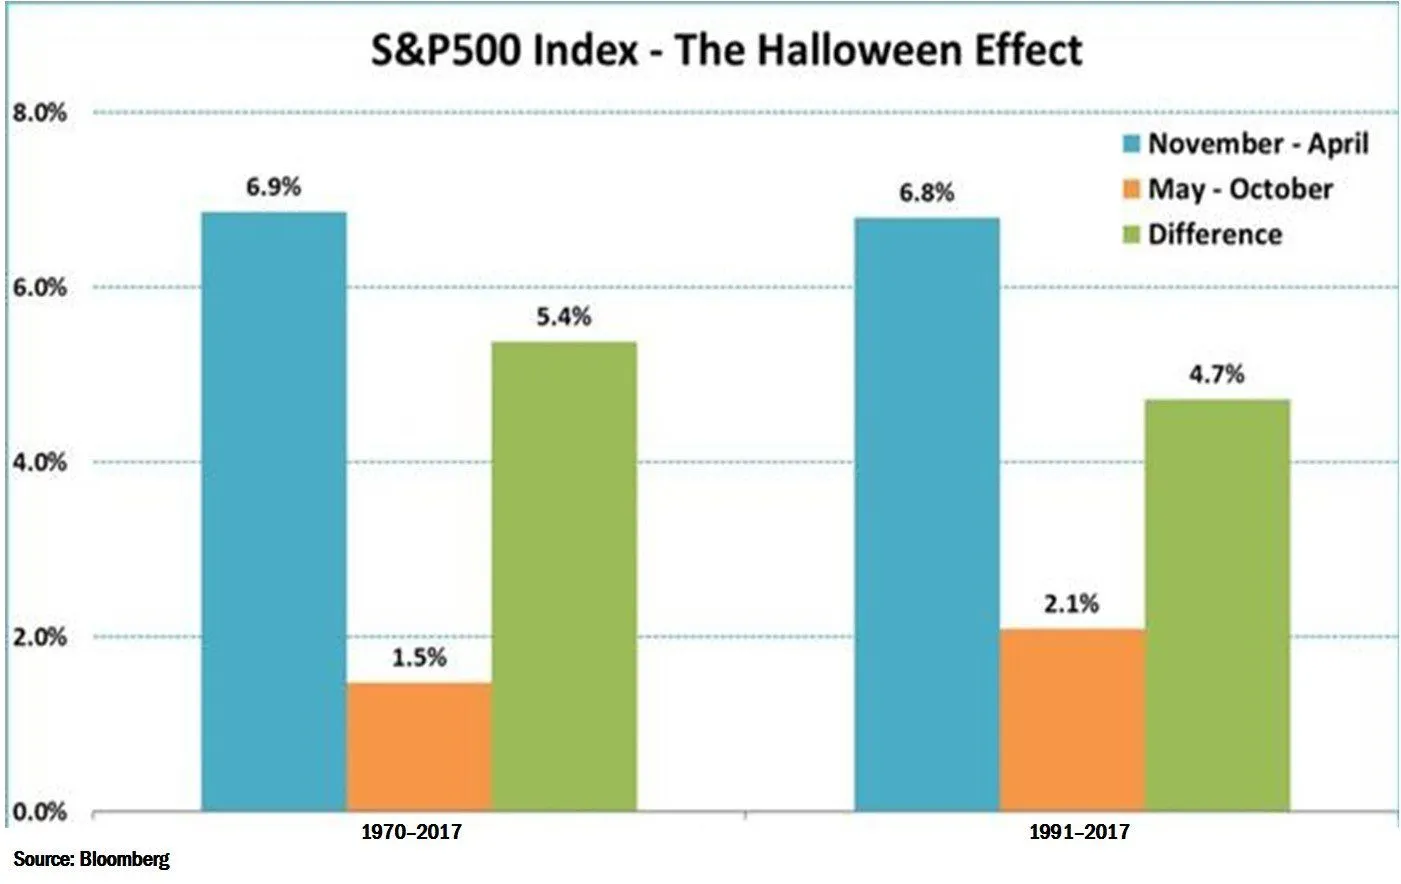
Halloween Strategy
TL;DR: The Halloween strategy is a seasonal investment strategy that involves selling stocks in May and buying them back in October.
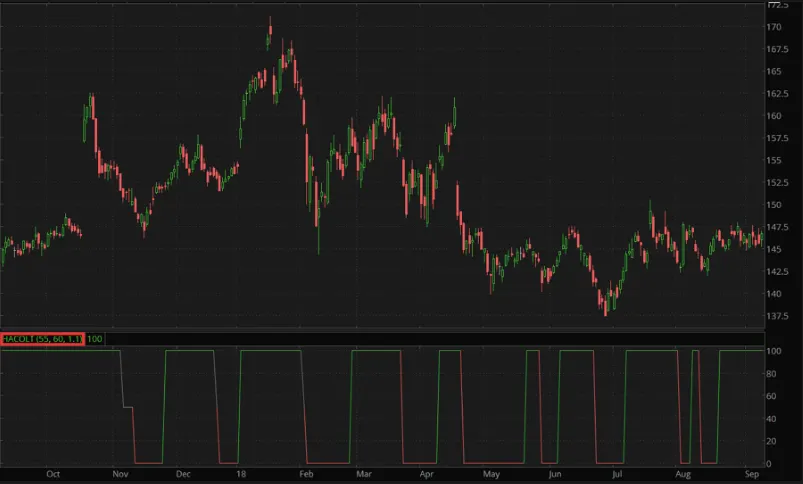
HACOLT Strategy
TL;DR: The HACOLT (Heikin Ashi Candles Oscillator Long Term) strategy is a trading strategy that helps identify long-term trends.
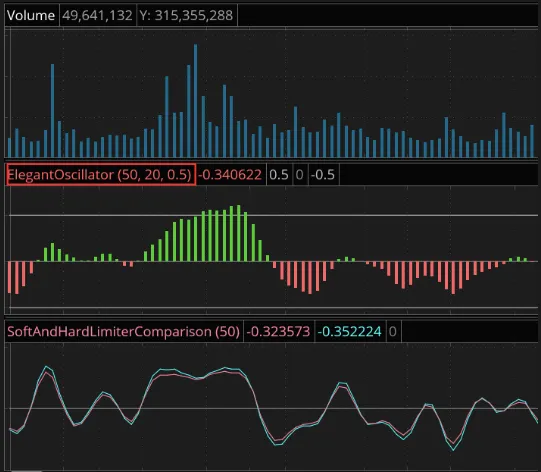
Elegant Oscillator Strategy
TL;DR: The Elegant Oscillator is a technical indicator used by traders to identify buy and sell signals in the stock market.
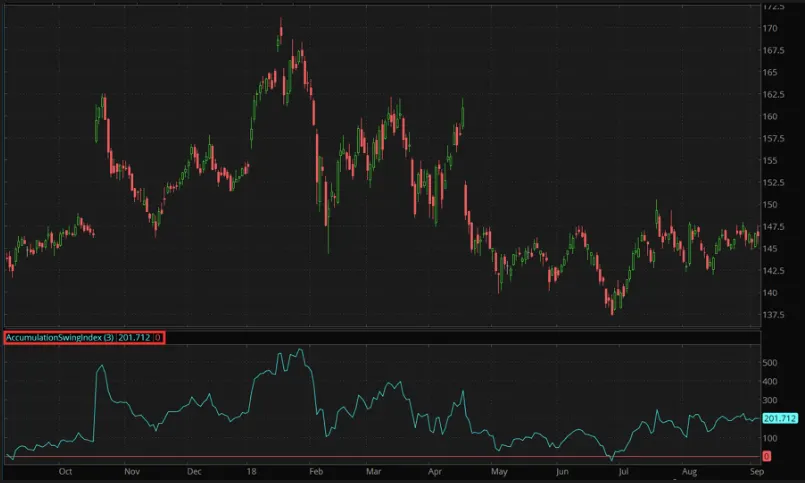
Accumulation Swing Index Study
TL;DR: The Accumulation Swing Index (ASI) is a technical indicator used to identify long-term trends in the stock market.
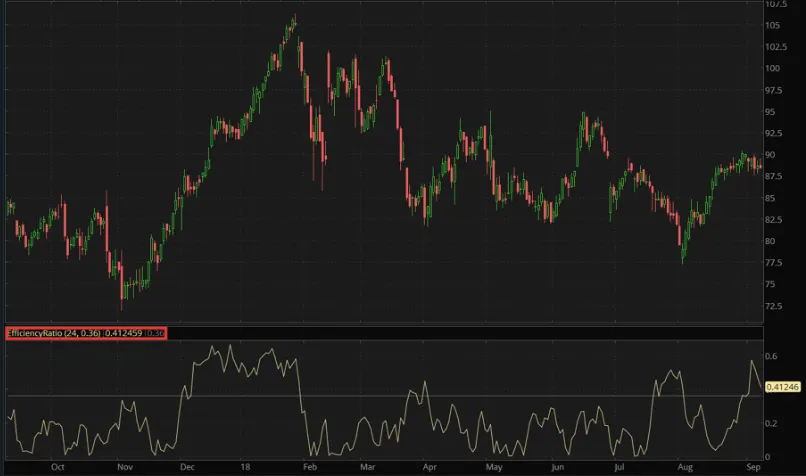
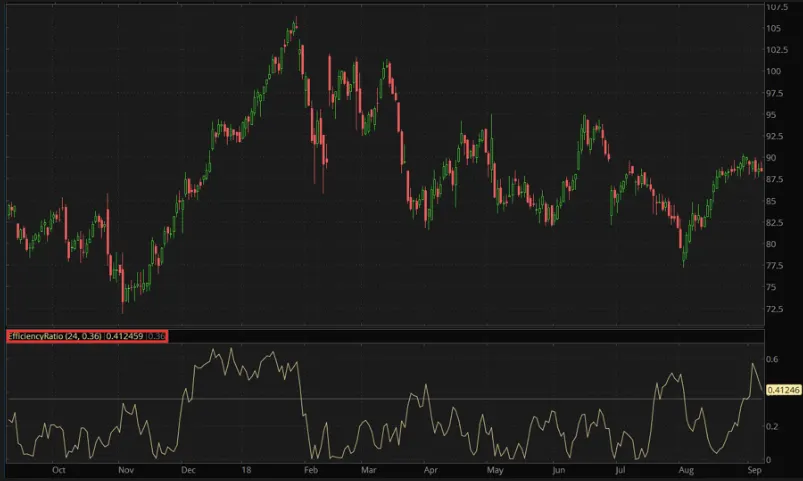
ER Trend Strategy
TL;DR: The ER Trend strategy is a trading strategy that uses the Efficiency Ratio (ER) indicator to identify trends in financial markets and generate buy and sell signals.
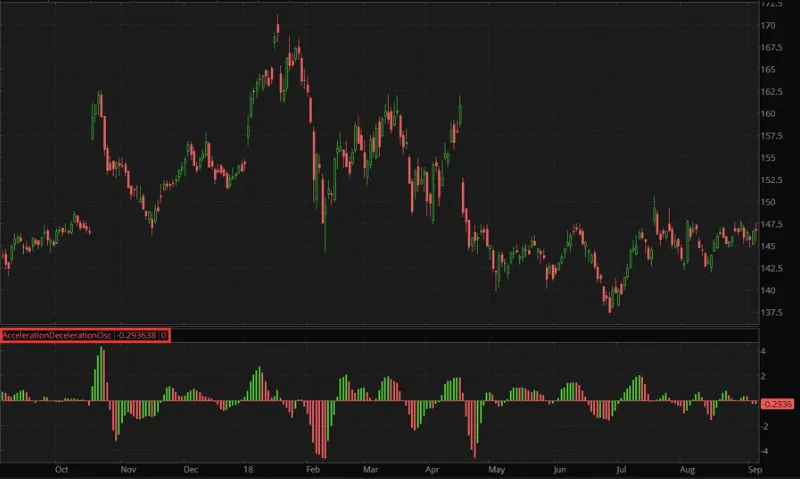
Acceleration Deceleration Oscillator Study
TL;DR: The Acceleration/Deceleration Oscillator (AC) study is a technical indicator used to identify momentum in the financial market.
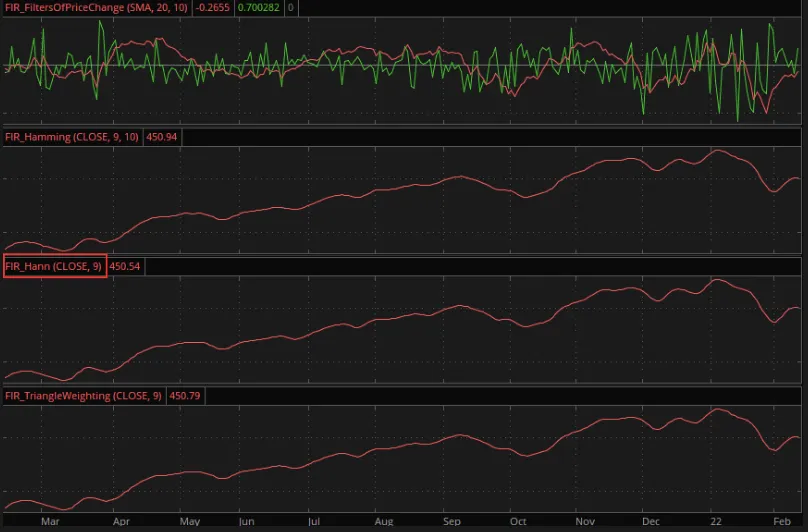
FIR Hann Study
TL;DR: The FIR Hann Indicator is a tool that helps traders filter data to find a balance between a simple moving average's filtering ability and its lag effect.
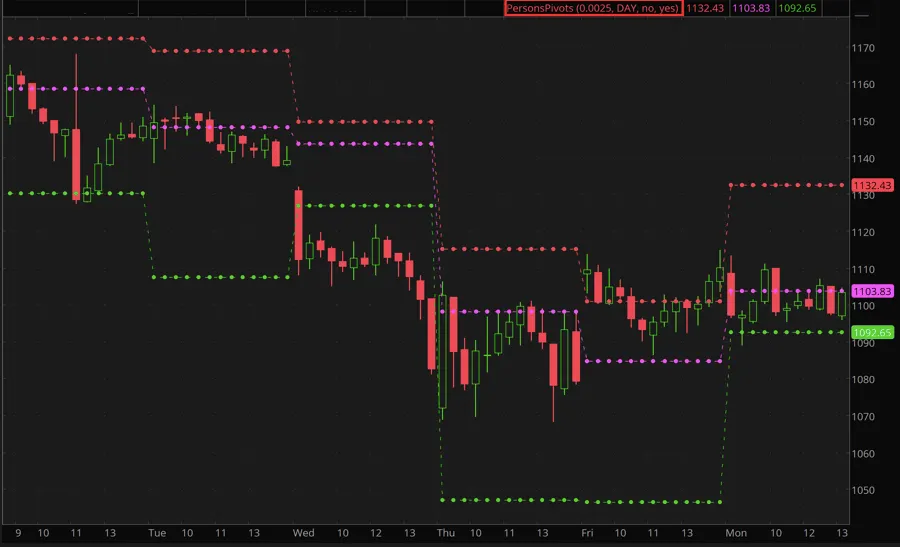
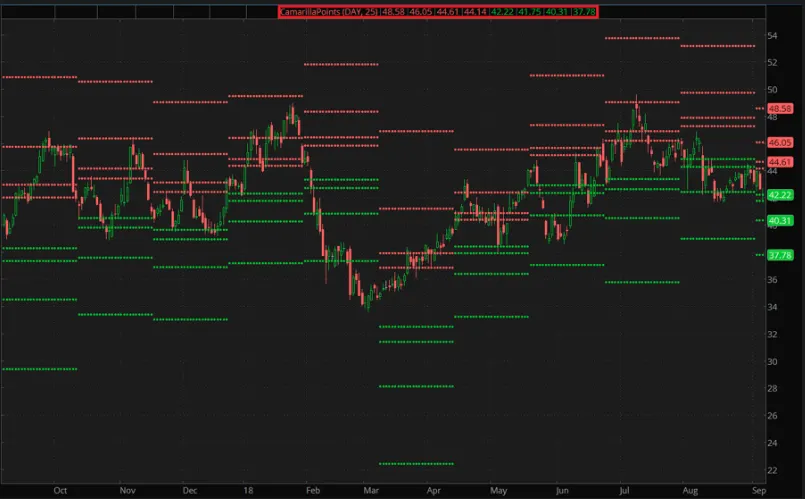
Persons Pivots Study
TL;DR: Person's Pivots is a pivot points indicator that helps traders identify key levels of support and resistance.
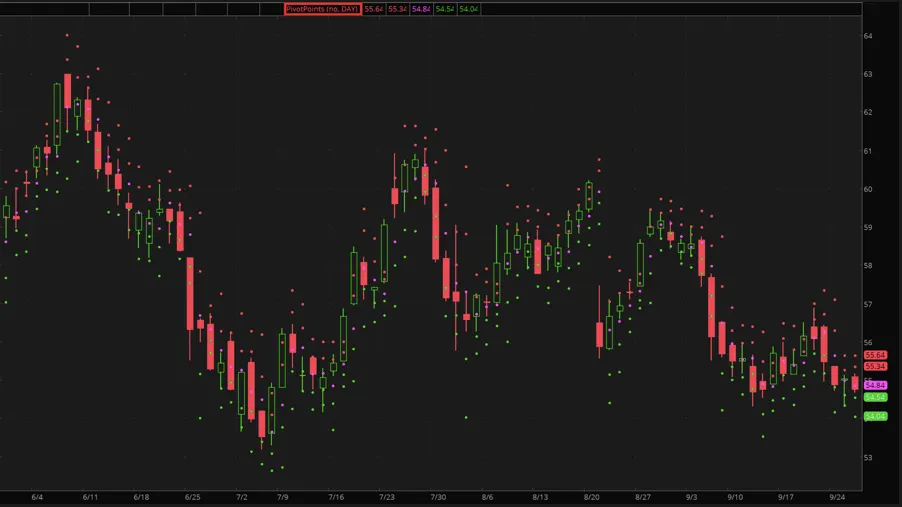
Pivot Points Study
TL;DR: Pivot Points is a tool used by traders to find key levels of support and resistance for a security.
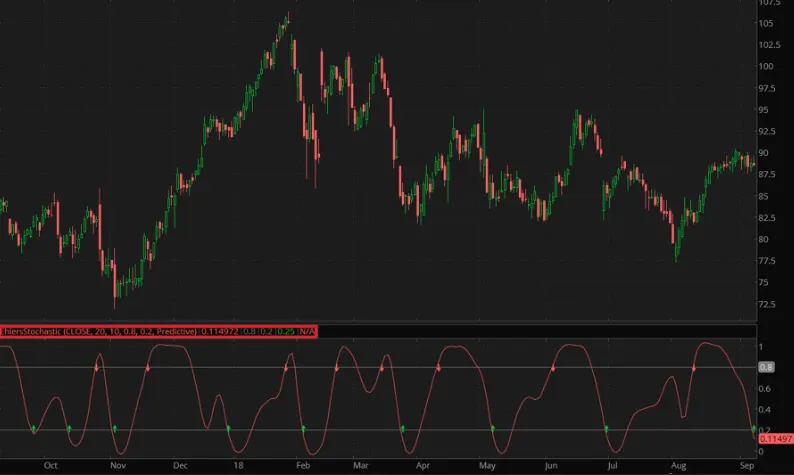
Ehlers Stochastic Strategy
TL;DR: The Ehlers Stochastic Study is a popular tool used by traders to find trading opportunities in the stock market.
ADX Breakout LE Strategy
TL;DR: The ADX Breakout LE strategy is a stock trading strategy that helps identify high-volatility breakouts.
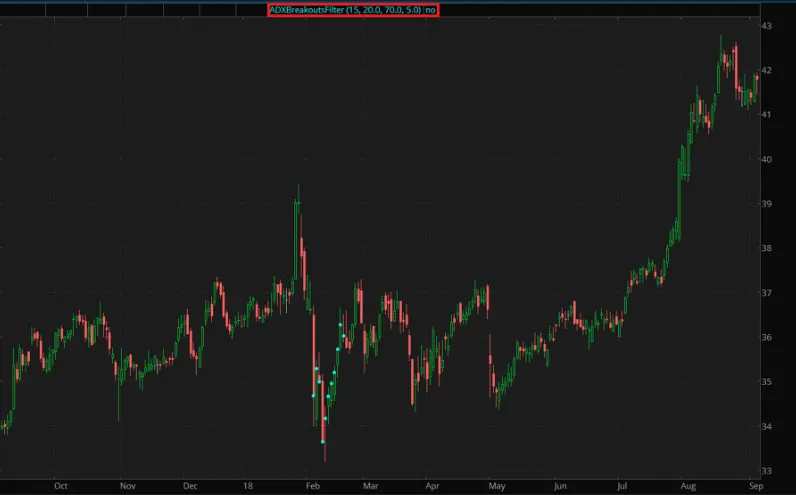
ADX Breakout Filter Study
TL;DR: The ADX Breakouts Filter is a trading tool used by traders to find good stocks to buy or sell.
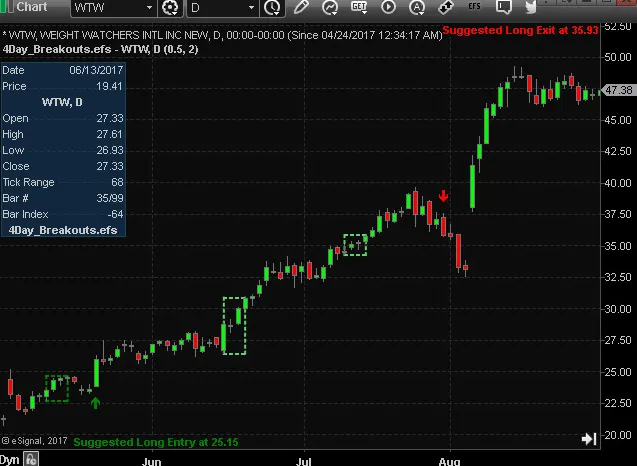
Four Day Breakout LE Strategy
TL;DR: The Four-Day Breakout Long Entry Strategy is a way to help traders decide when to buy securities.
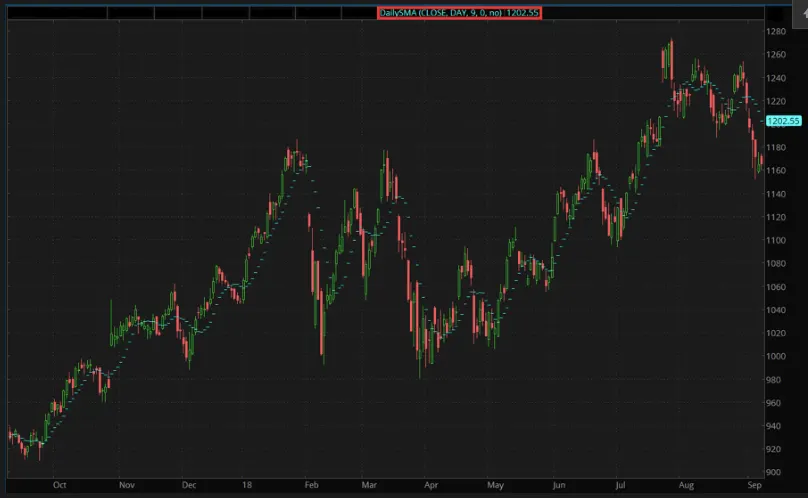
Daily SMA Study
TL;DR: The Daily SMA Indicator is a tool that helps traders make better investment decisions by analyzing financial markets.
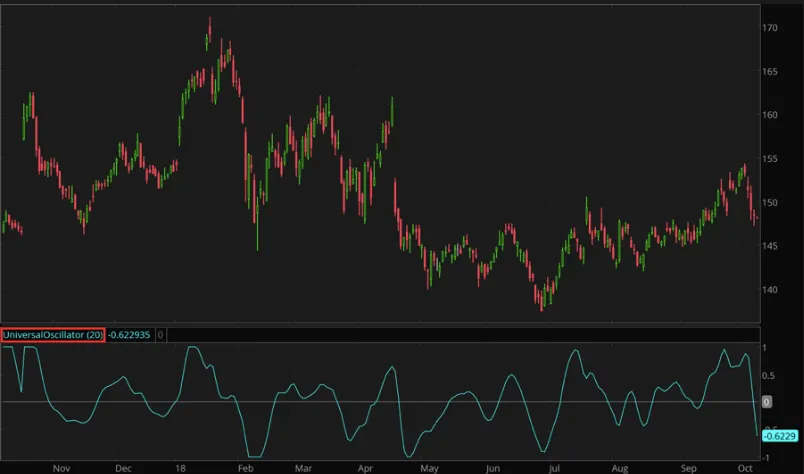
Universal Oscillator Study
TL;DR: The Universal Oscillator is a tool used in the stock market to make decisions about buying and selling stocks.

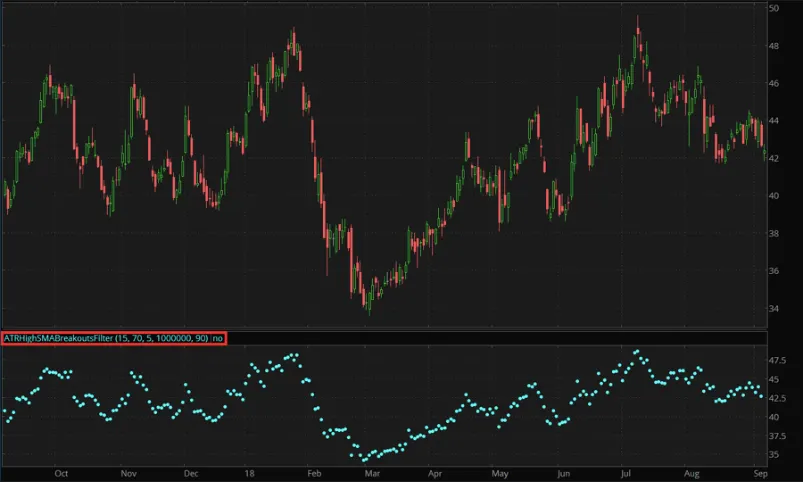
ATR High SMA Breakouts Filter Study
TL;DR: The ATR High SMA Breakouts Filter is a tool used in trading stocks that helps you make smart investment decisions.
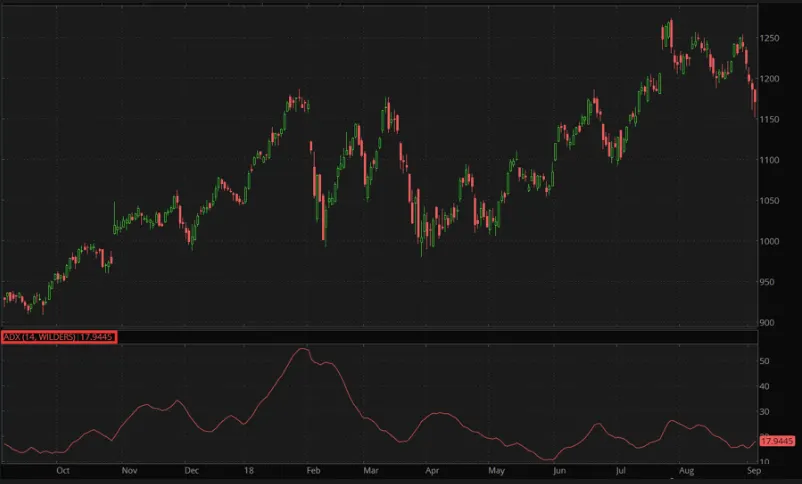
ADX Trend Strategy
TL;DR: The ADX Trend strategy is an investment strategy that uses the Average Directional Index (ADX) indicator to make decisions based on trends.
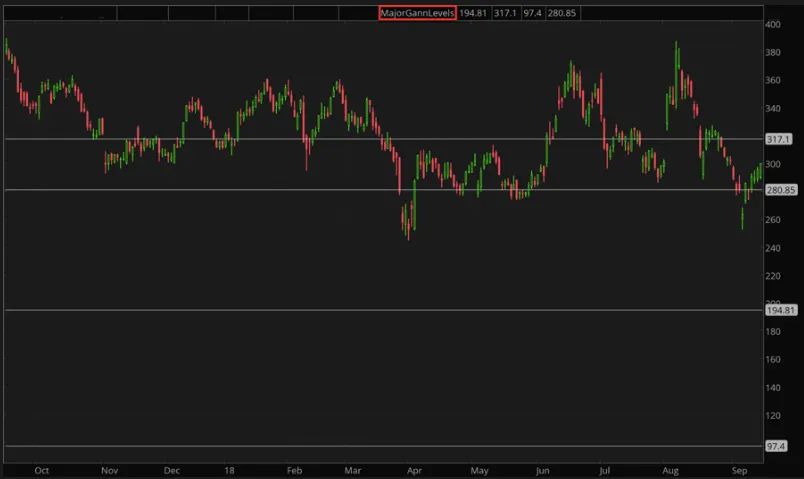
Major Gann Levels Study
TL;DR: The Major Gann Levels study is a tool used by traders to predict future price movements in the stock market.
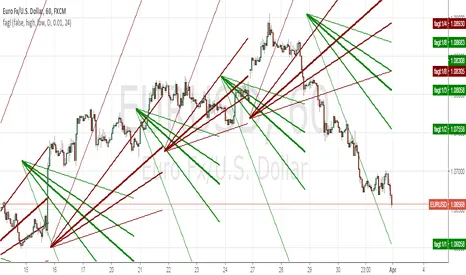
What Are Gann Indicators?
TL;DR: Gann Indicators are tools used by traders to predict future price movements based on the idea that markets rotate from angle to angle.

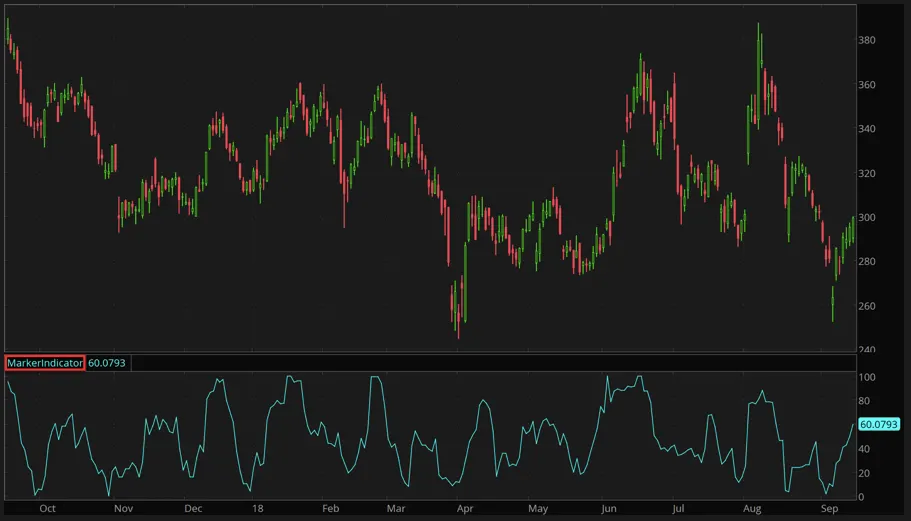
Marker Indicator Study
TL;DR: The Marker Indicator is a technical analysis tool used to predict trend reversals by comparing changes in high and low prices.
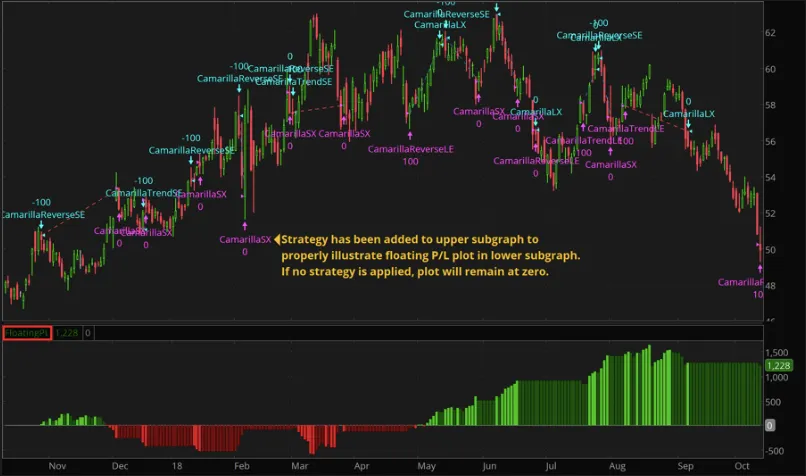
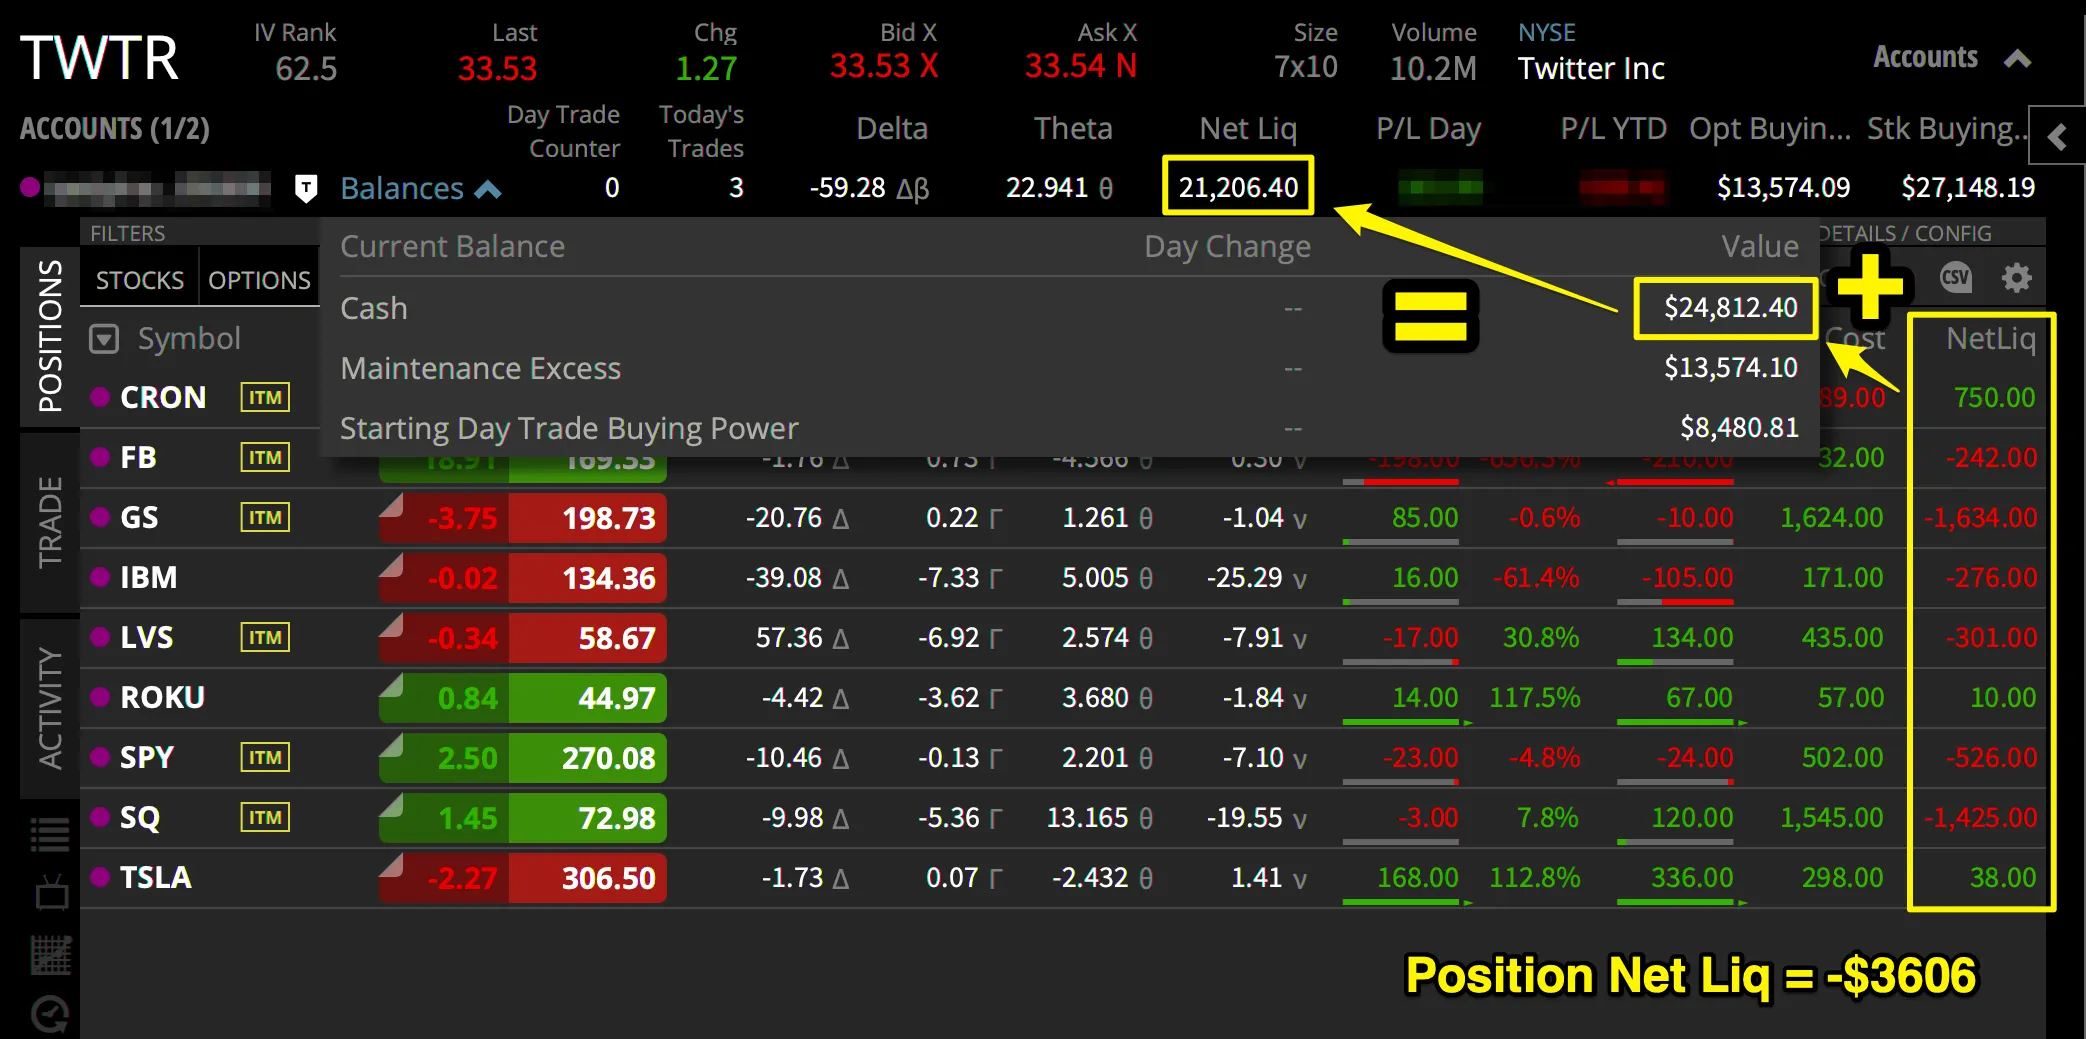
Floating Profit/Loss Study
TL;DR: The floating profit/loss indicator is a tool that helps traders track the profit or loss of an open trade position.
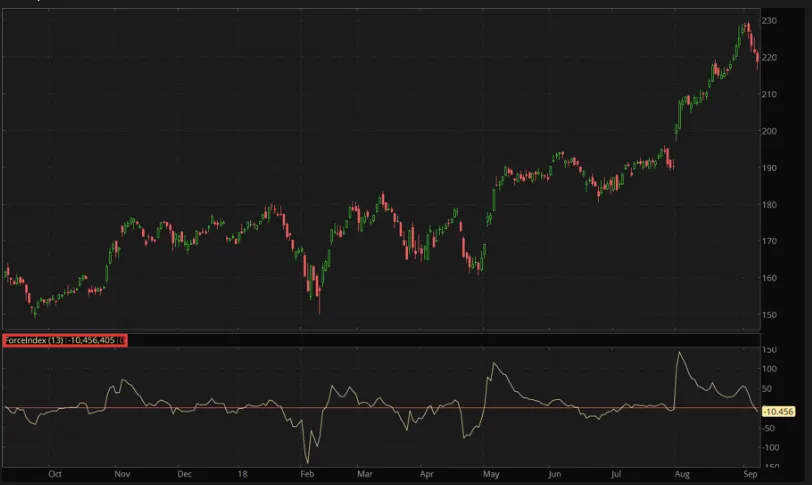
Force Index Study
TL;DR: The Force Index is a technical indicator that measures the strength of price movements in the market by combining price movements and trading volume.
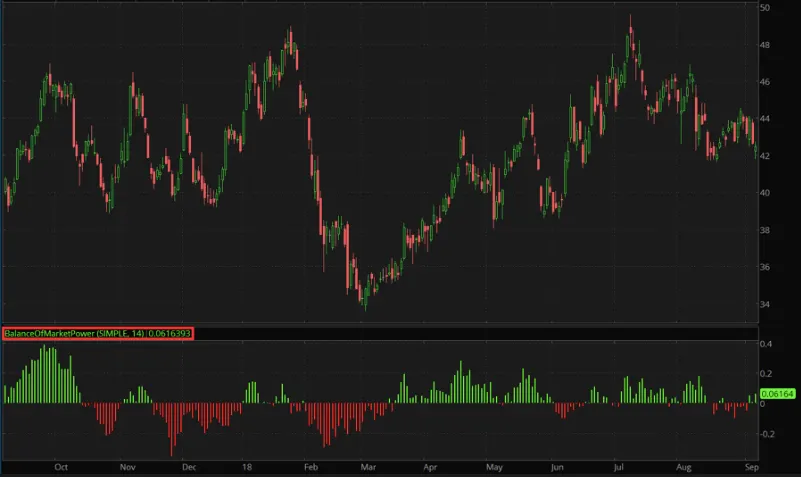
Balance of Market Power Study
TL;DR: The Balance of Market Power is a price-based indicator used by technical analysts to evaluate the overall strength of buyers and sellers in the market.
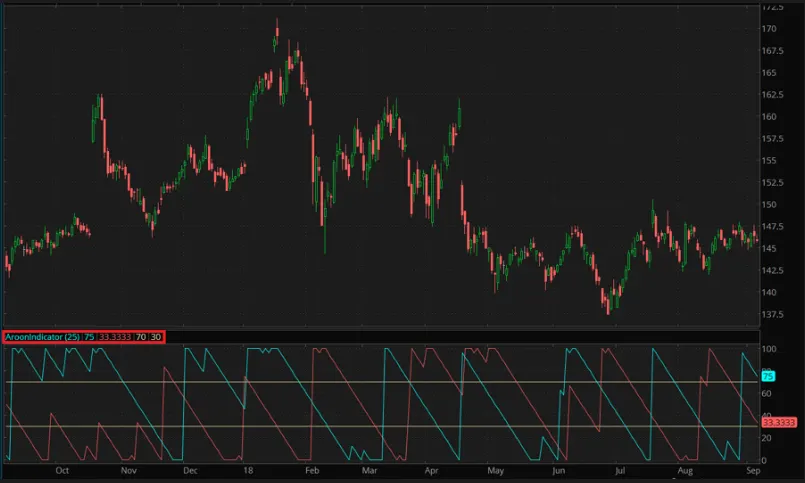
Aroon Indicator Study
TL;DR: The Aroon indicator is a technical analysis tool used to identify trend changes and the strength of those trends in a security's price.
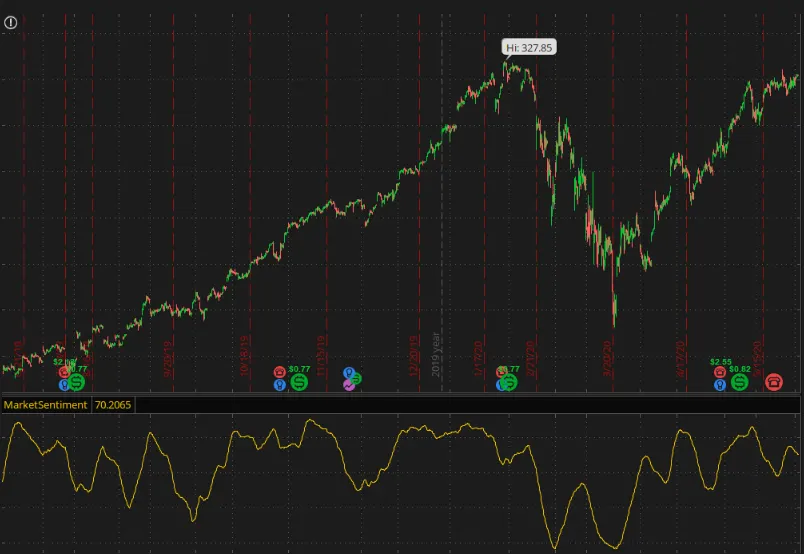
Sentiment Zone Strategy
TL;DR: The Sentiment Zone strategy is based on values of Sentiment Zone Oscillator (SZO) and their relation with dynamic overbought and oversold levels.

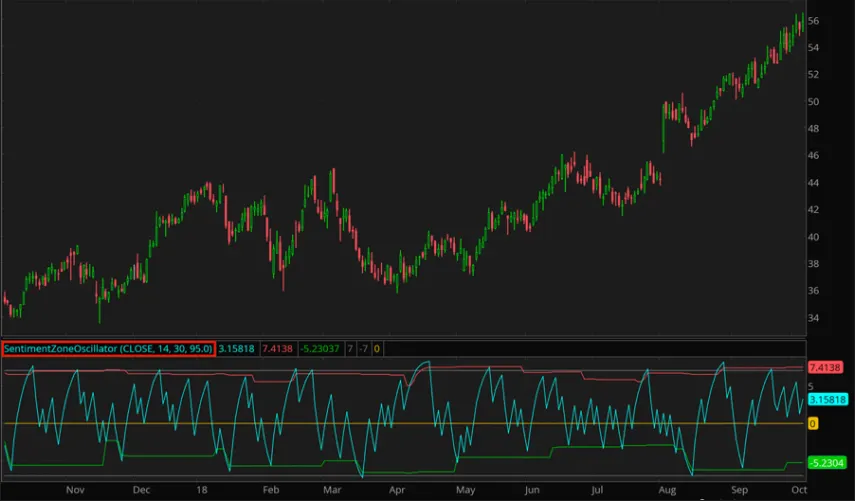
Sentiment Zone Oscillator Study
TL;DR: The Sentiment Zone Oscillator (SZO) is a technical indicator that measures market sentiment and identifies overbought and oversold levels.
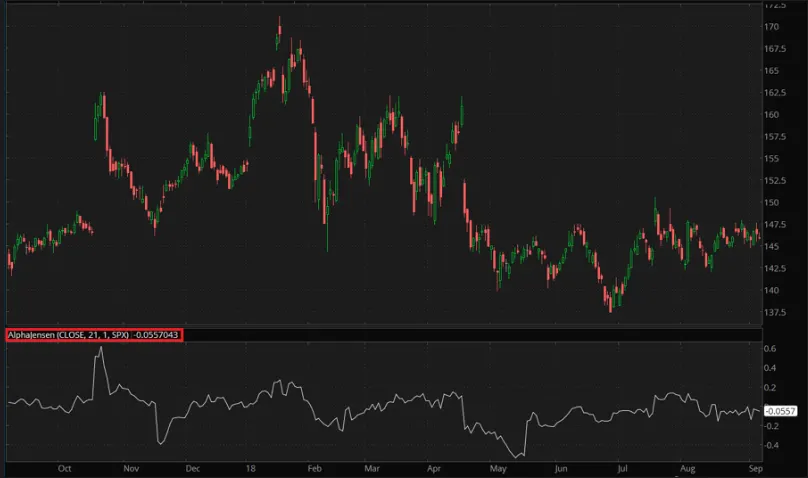
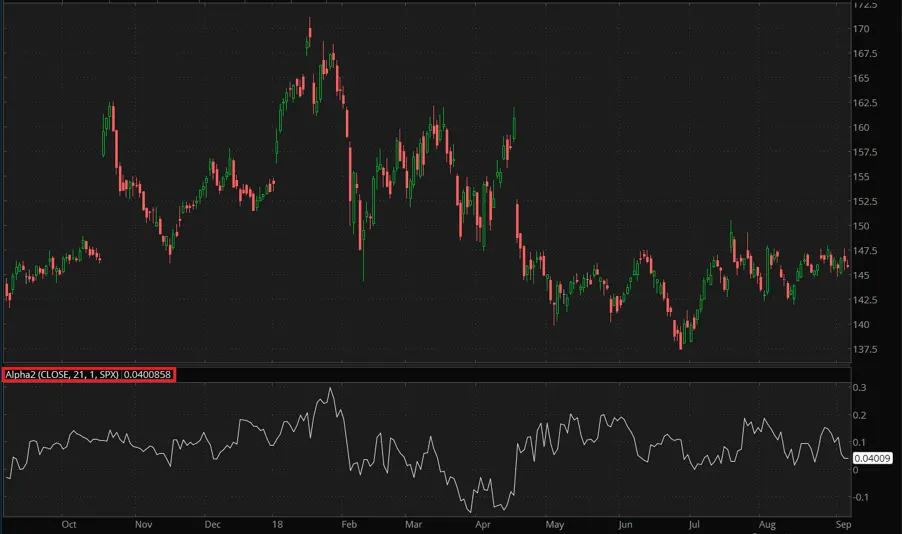
Jensen’s Alpha Study
TL;DR: Jensen's Alpha is a measure used to determine if a portfolio's return compensates for the risk it takes.
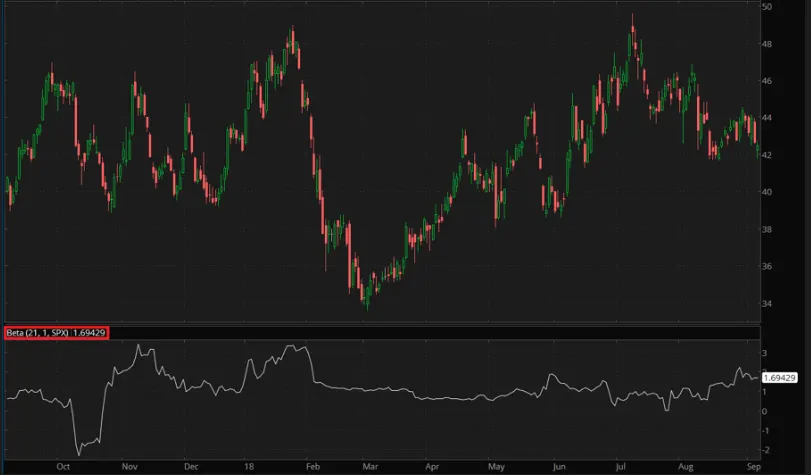
Beta Study
TL;DR: Beta is a measurement of market risk or volatility, indicating how much a stock's price fluctuates compared to other stocks.
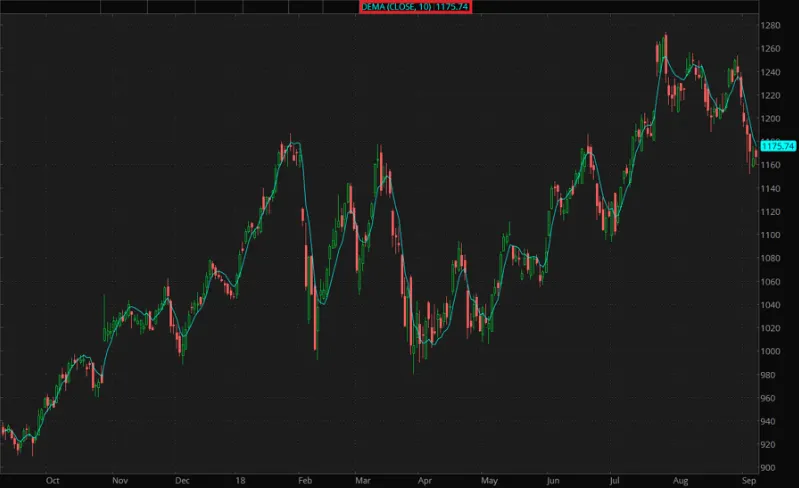
Double Exponential Moving Average (DEMA) Study
TL;DR: The Double Exponential Moving Average (DEMA) is a technical indicator used to reduce lag and noise in the results produced by a traditional moving average.
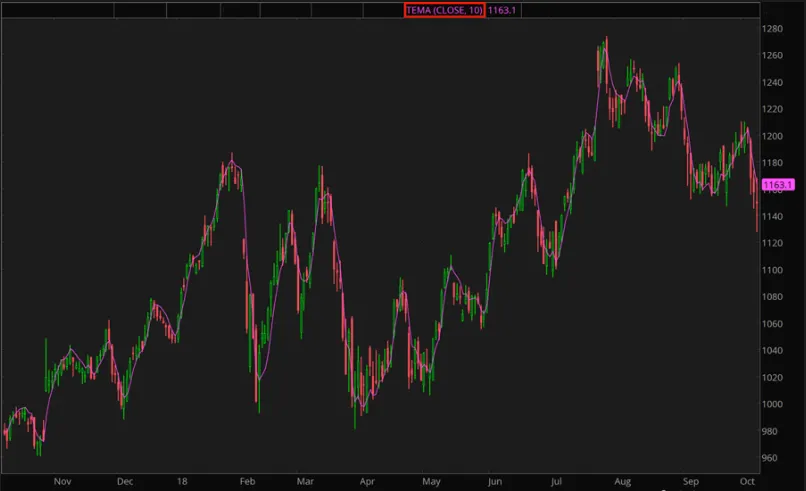
Triple Exponential Moving Average (TEMA) Study
TL;DR: The Triple Exponential Moving Average (TEMA) is an indicator designed to smooth price fluctuations and help identify trends.
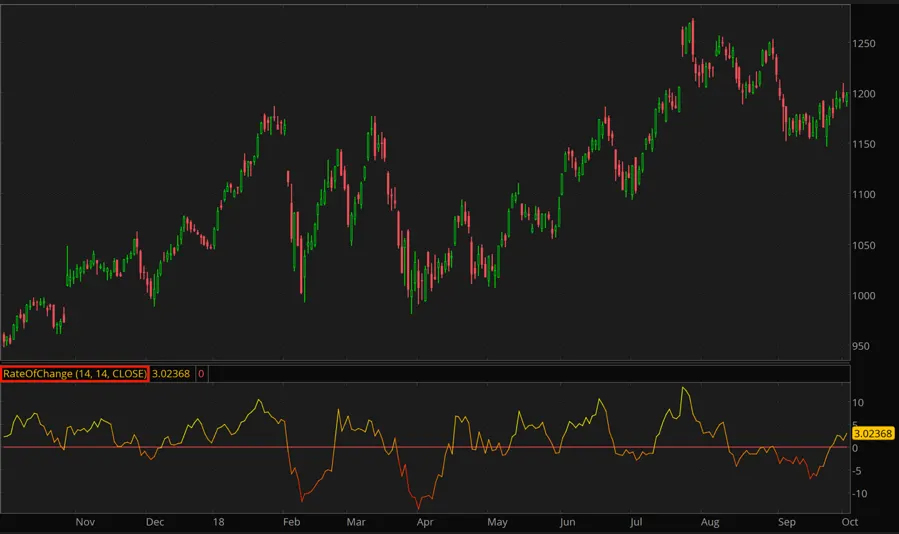
Rate of Change Study
TL;DR: The Price Rate of Change (ROC) is a technical indicator that measures the percentage change in price between the current price and the price a certain number of days ago (n value).
Average Percent True Range Study
TL;DR: The Average Percentage True Range (APTR) is a technical indicator that measures volatility using percentage values instead of absolute ones, allowing for comparison across different securities.
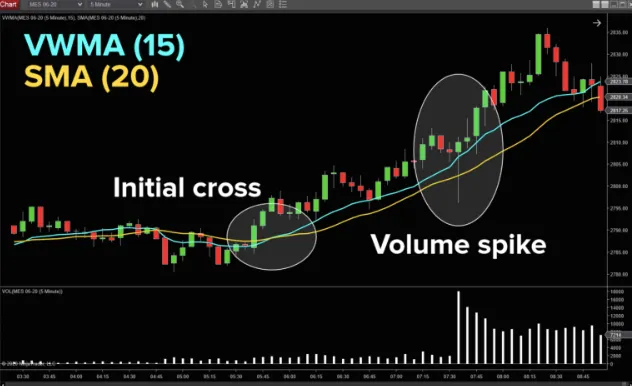
VWMA Breakouts Strategy
TL;DR: The VWMA Breakouts strategy is a trading method that combines the features of a simple moving average and a volume-weighted moving average to create buy/sell signals.
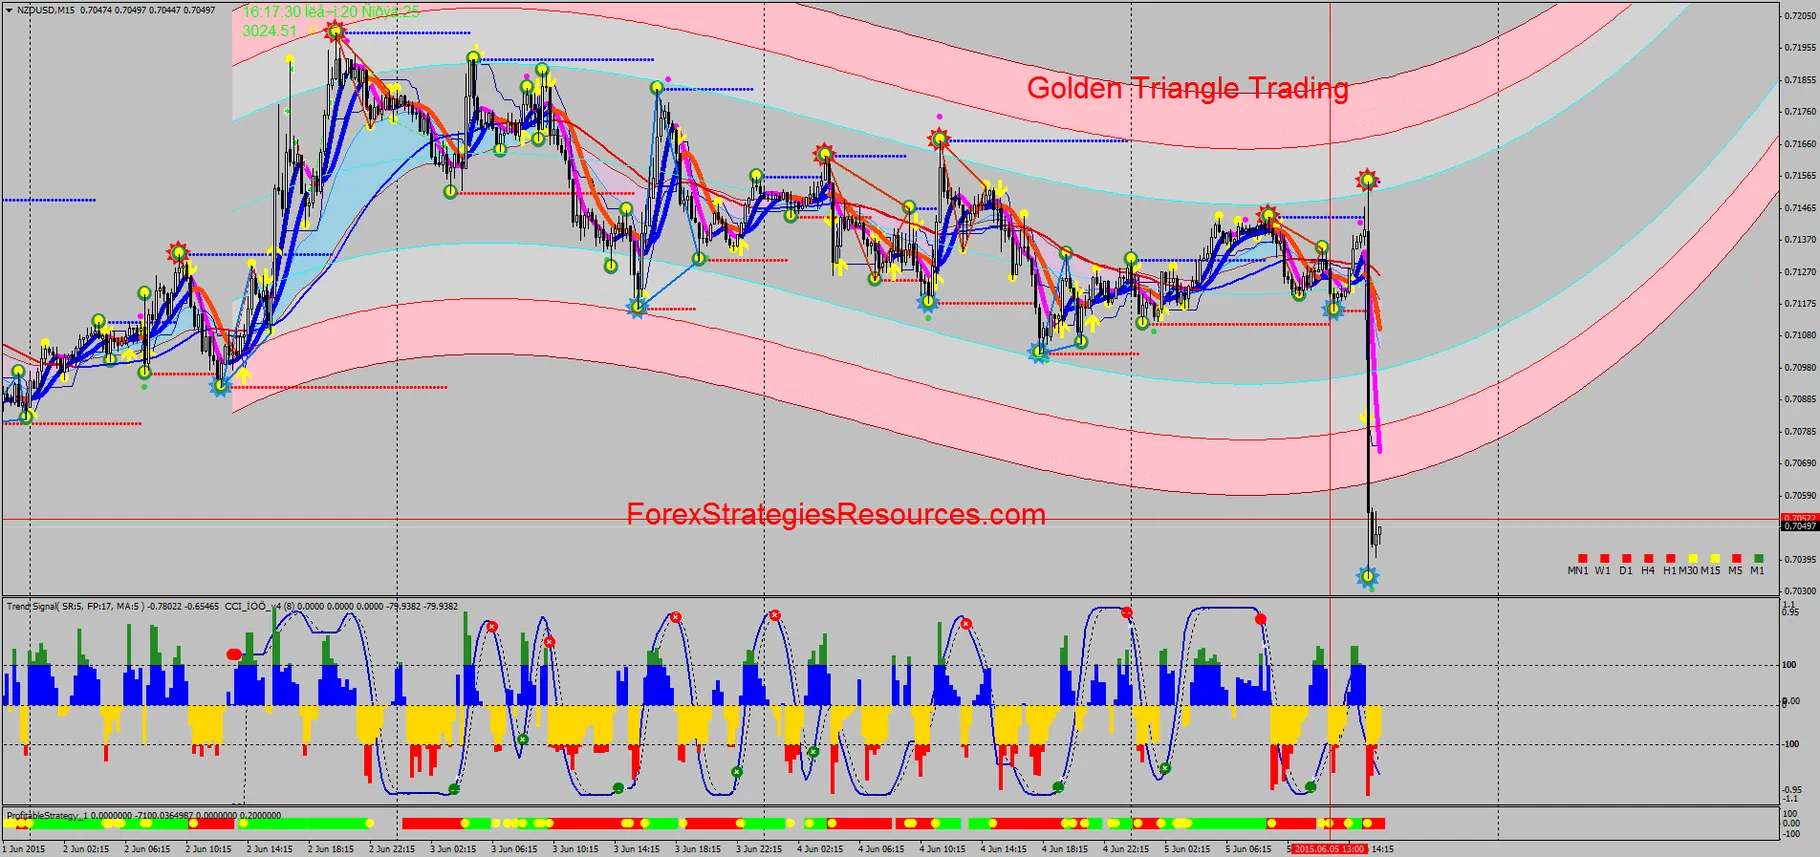
Golden Triangle Long Entry Strategy
TL;DR: The Golden Triangle Long Entry strategy is a technical indicator used to identify entry points in stocks.

Volty Expan Close LX Strategy
TL;DR: The Volty Expan Close Long Exit (LX) strategy generates Long Exit signals based on the Average True Range (ATR).
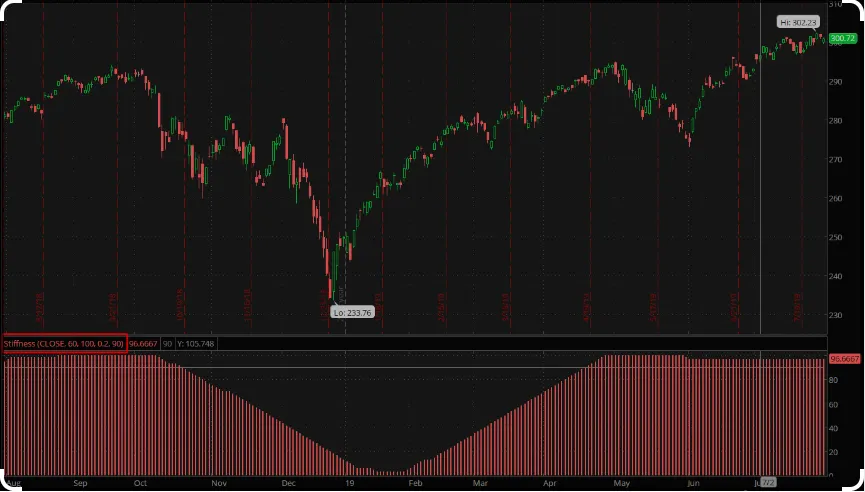
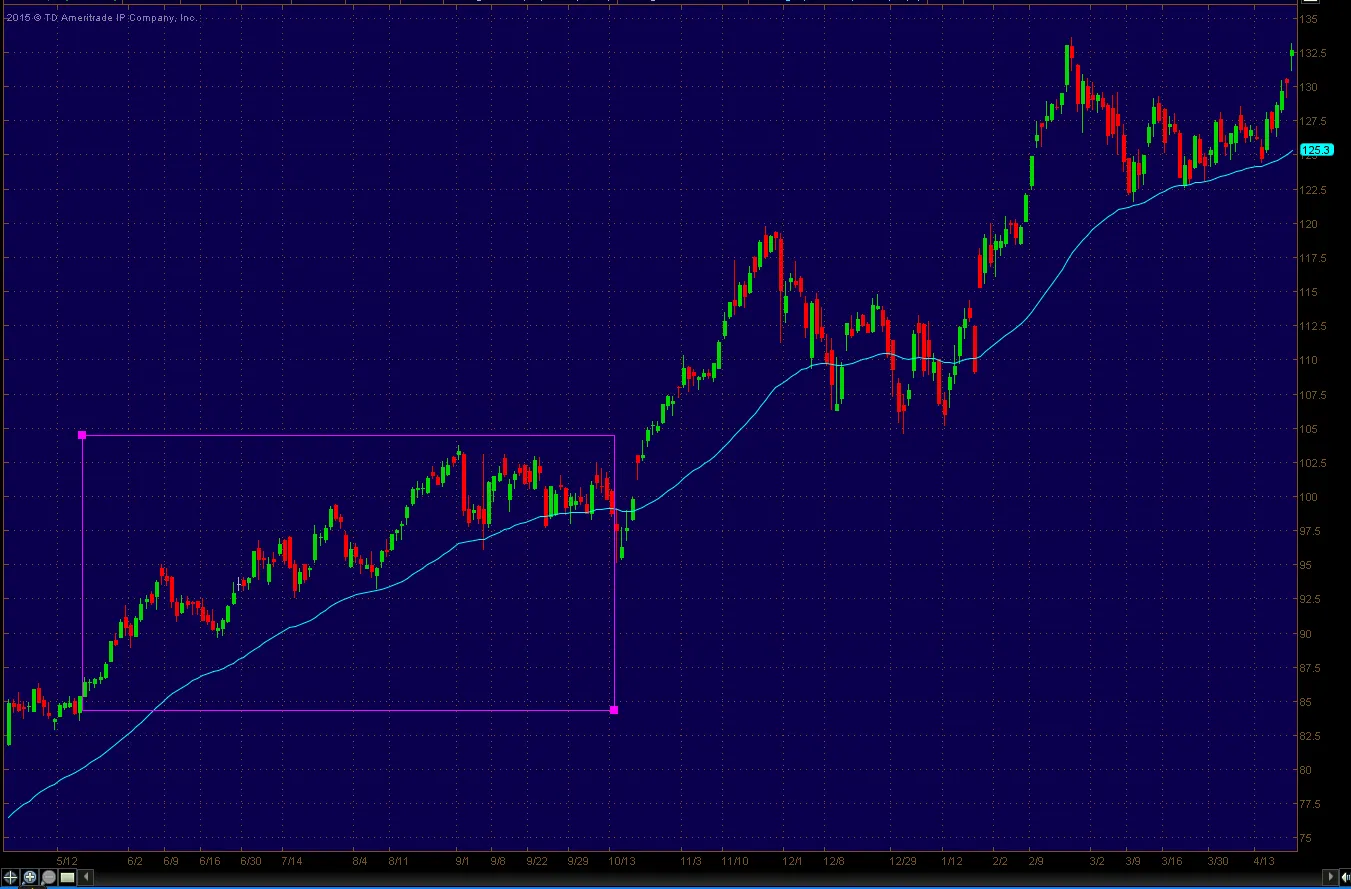
Stiffness Strategy
TL;DR: The Stiffness strategy evaluates trend strength by counting how often the price closes above its 100-day moving average.
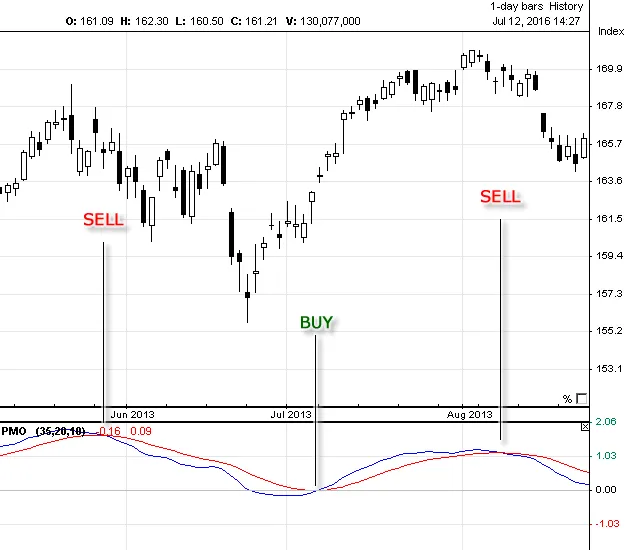
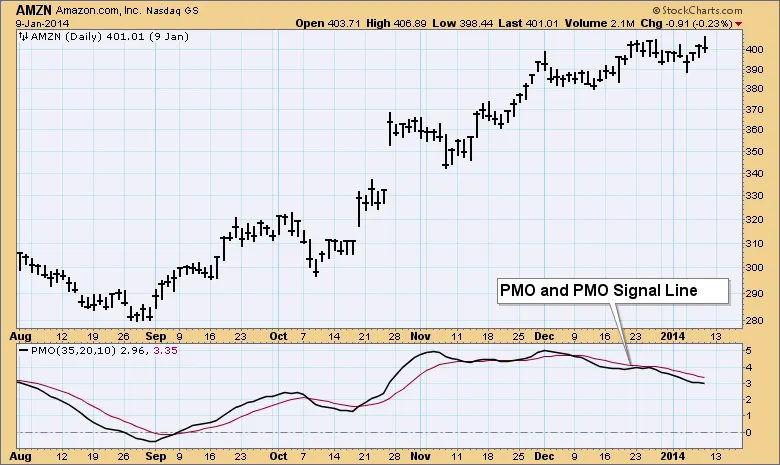
Price Momentum Oscillator Study
TL;DR: The Price Momentum Oscillator (PMO) study was developed by Carl Swenlin and is a rate of change based study that uses a double smoothing method to track a stock or index's relative momentum.
Price Momentum Oscillator Strategy
TL;DR: The PMO strategy is a stock or index trading approach based on the signals from the Price Momentum Oscillator, which tracks relative momentum through...
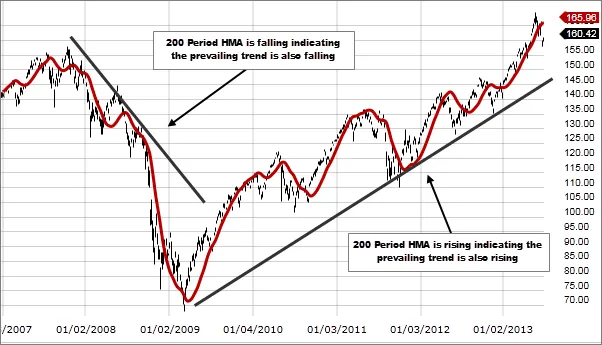
What Is a Lagging Indicator?
TL;DR: A lagging indicator is a financial sign that confirms trends but doesn't predict them. It uses past data to indicate where the price of an asset may be headed.
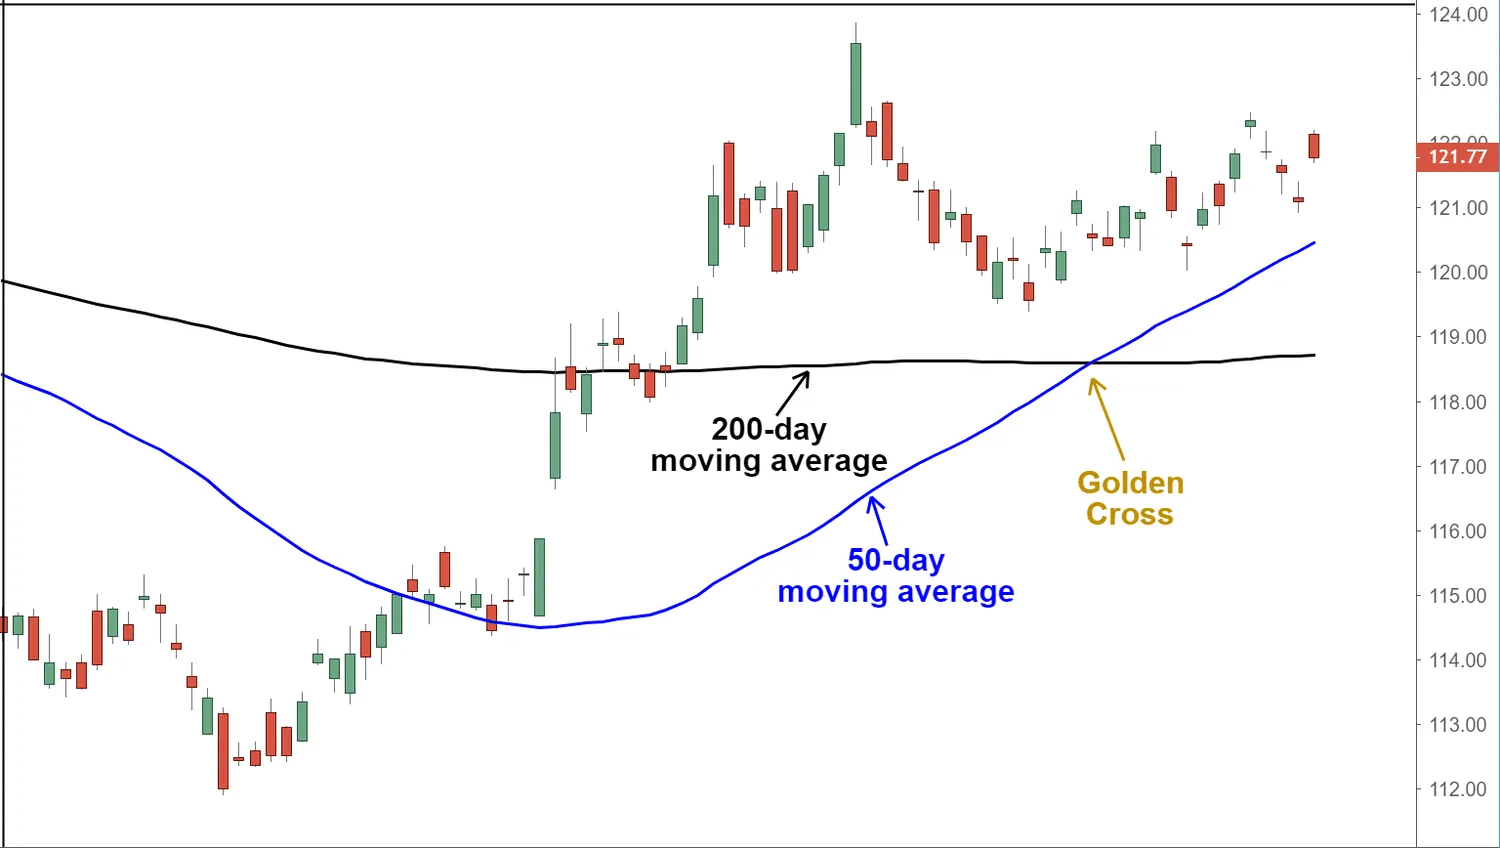
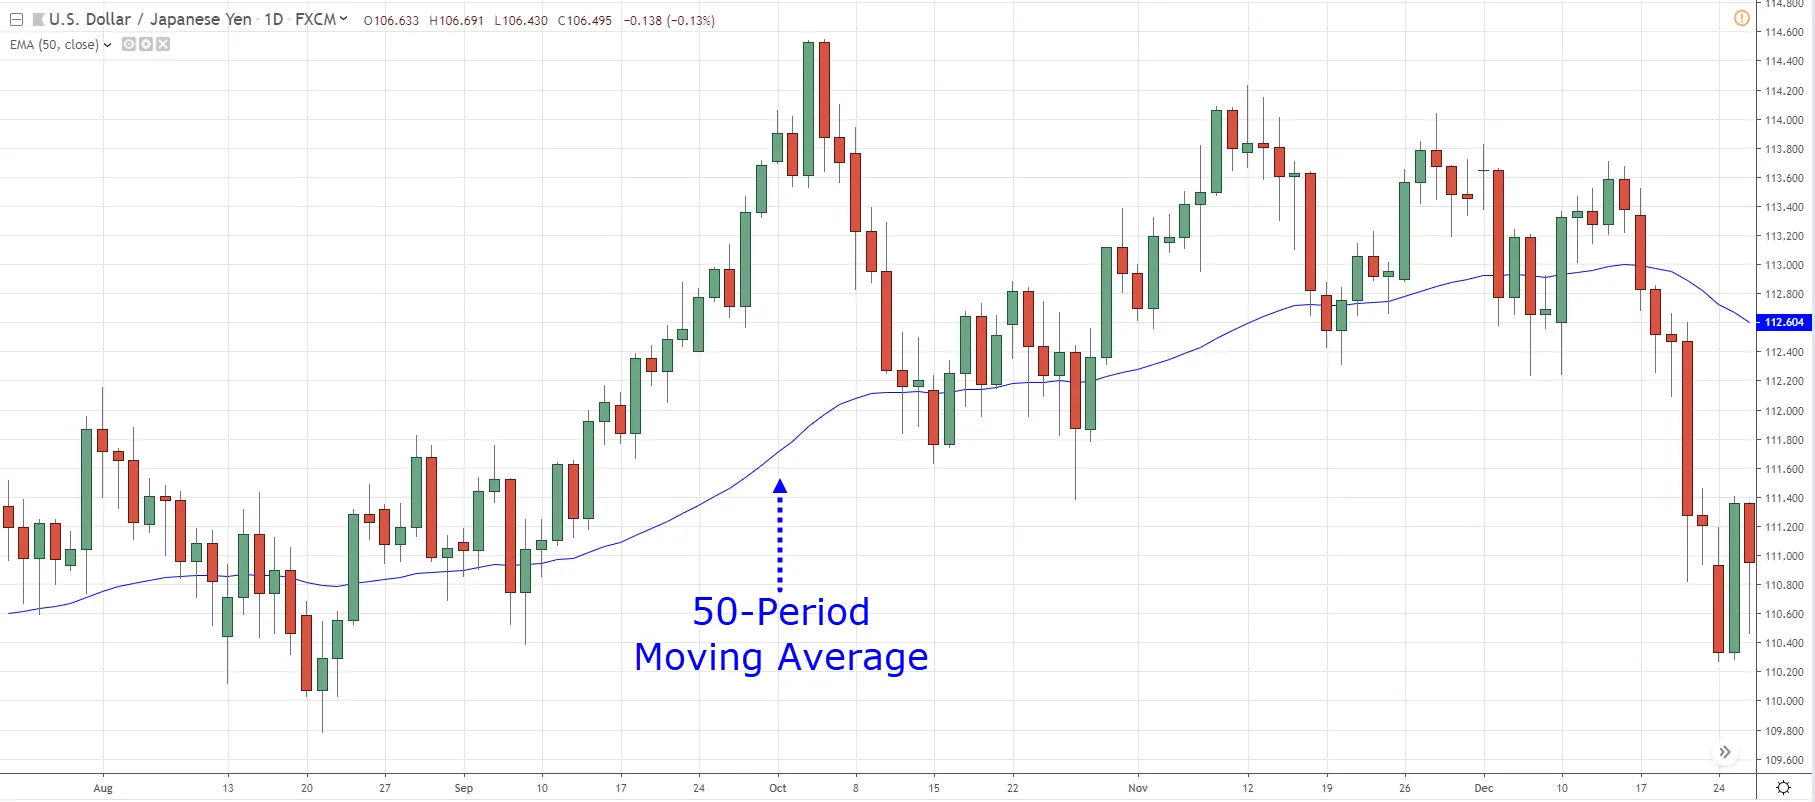
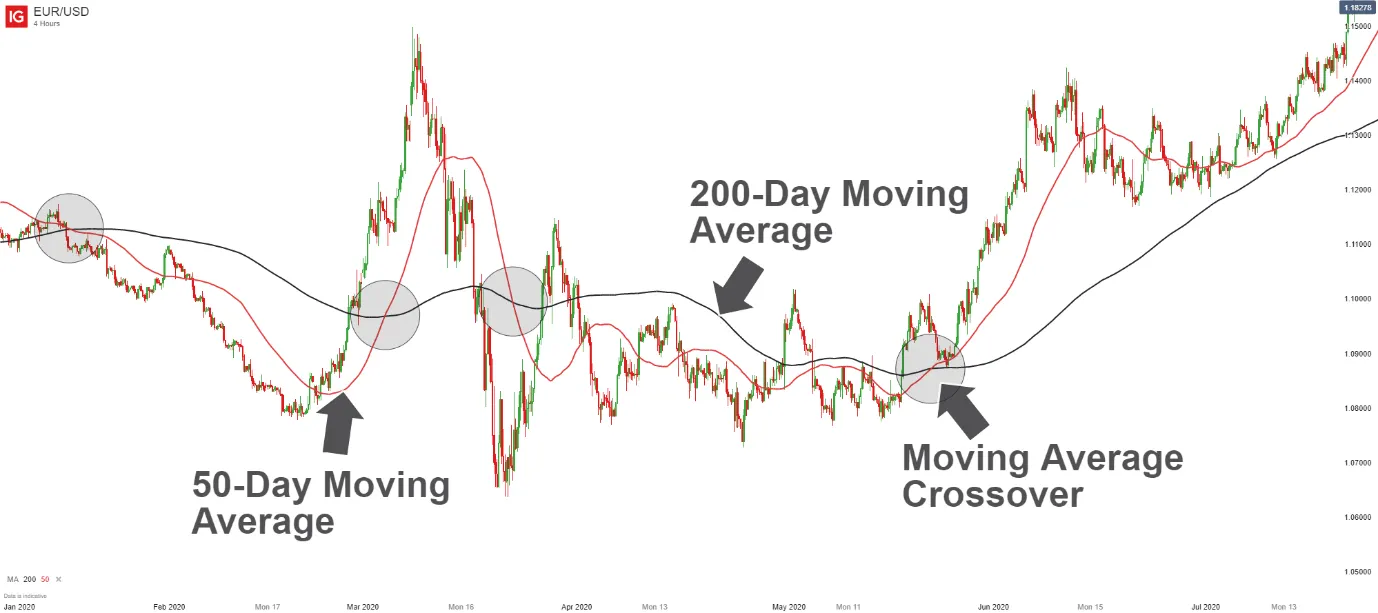
Golden Cross Strategy
TL;DR: A Golden Cross Breakout is a trading strategy that uses a short-term moving average (50-day) crossing above a long-term moving average (200-day) as a sign of a potential long-term bull market.
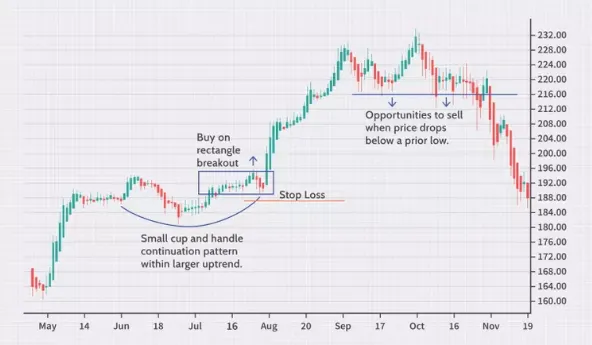
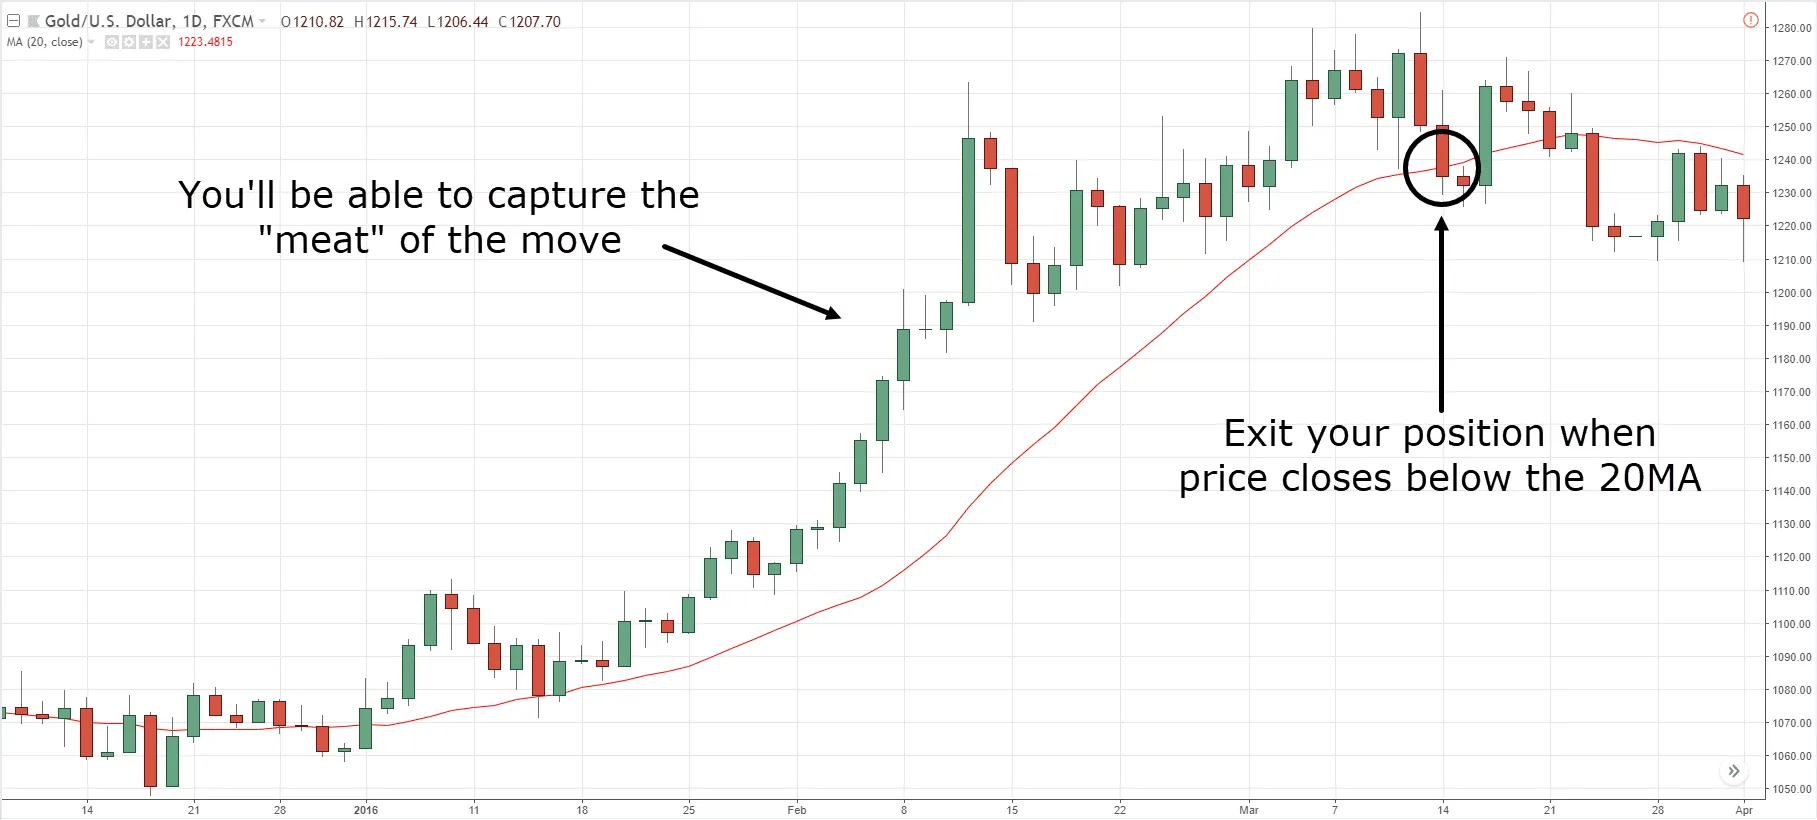
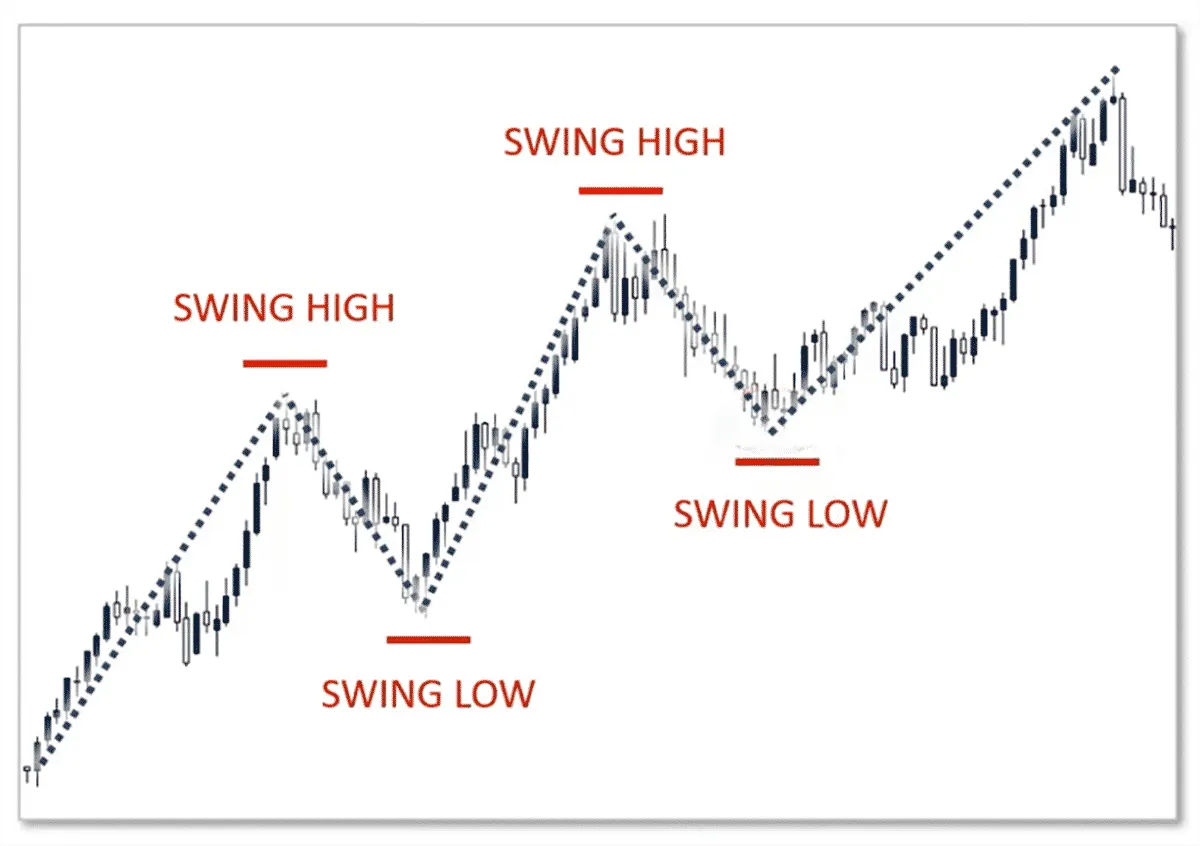
What Is Swing Trading?
TL;DR: Swing trading is a style of trading that aims to capture short- to medium-term gains in a stock or any financial instrument over a period of a few days to several weeks.
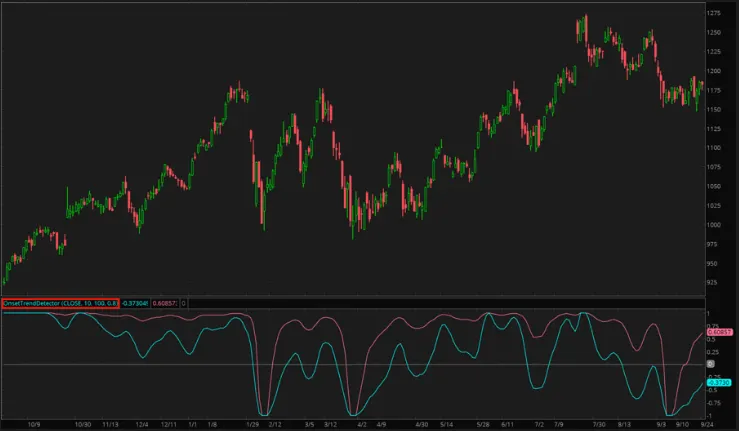
Onset Trend Strategy
TL;DR: The Onset Trend strategy is a zero-lag trend analyzing oscillator that uses the Super Smoother Filter and the Roofing Filter to detect trends in the market and generate...
Onset Trend Detector Study
TL;DR: The Onset Trend Detector is a tool for analyzing trends in stock data. Its main purpose is to remove the lag effect.

What’s the Difference Between Smoothing and Averaging?
TL;DR: Averaging and smoothing are two different techniques that can be used to analyze data and make sense of it.
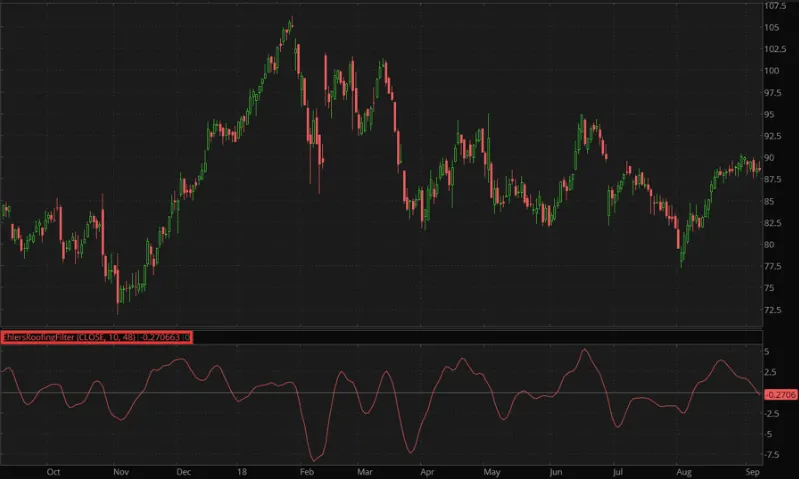
Ehlers Roofing Filter Study
TL;DR: The Ehlers Roofing Filter is a tool that helps make sense of stock market data by removing the random fluctuations that make it difficult to see the trends and patterns.
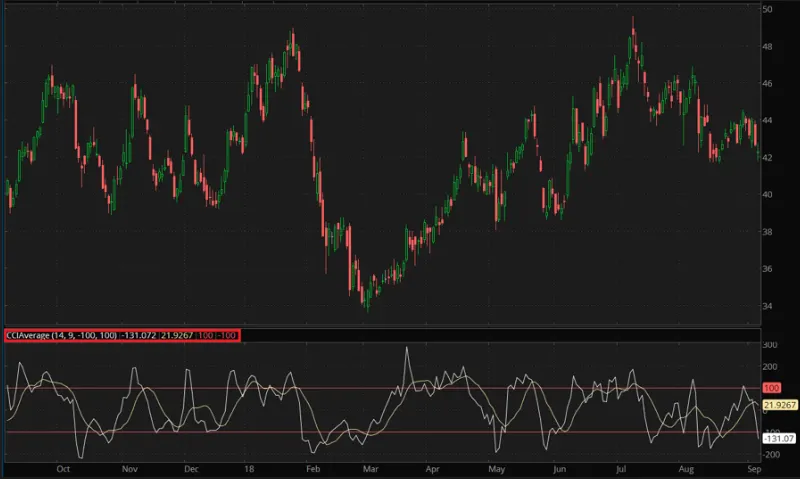
Commodity Channel Index Average Study
TL;DR: The Commodity Channel Index (CCI) Average plots an average of the Commodity Channel Index over a defined time period.
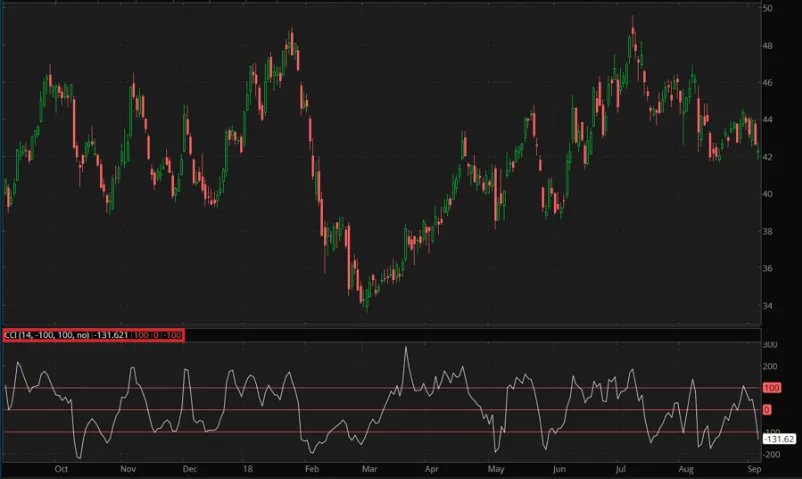
Commodity Channel Index Study
TL;DR: The Commodity Channel Index (CCI) is a momentum-based oscillator used to help determine when an investment is nearing overbought or oversold conditions.
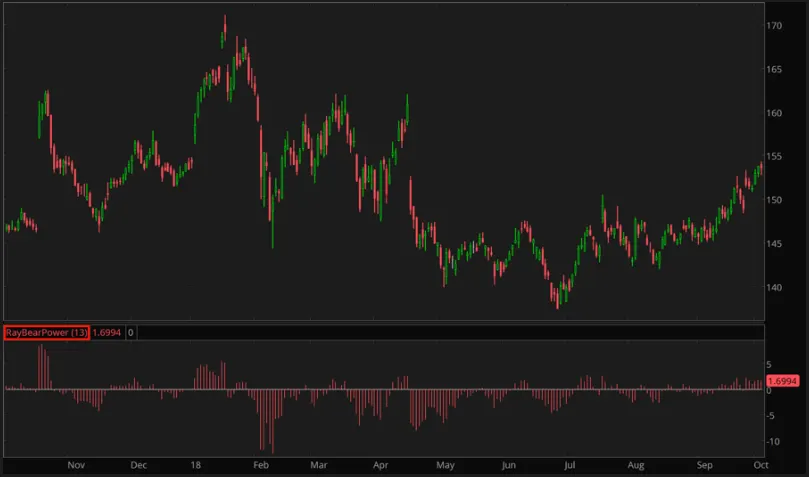
Ray Bear Power Study
TL;DR: The Ray Bear Power study plots only the Bear Power component of the Elder Ray indicator.
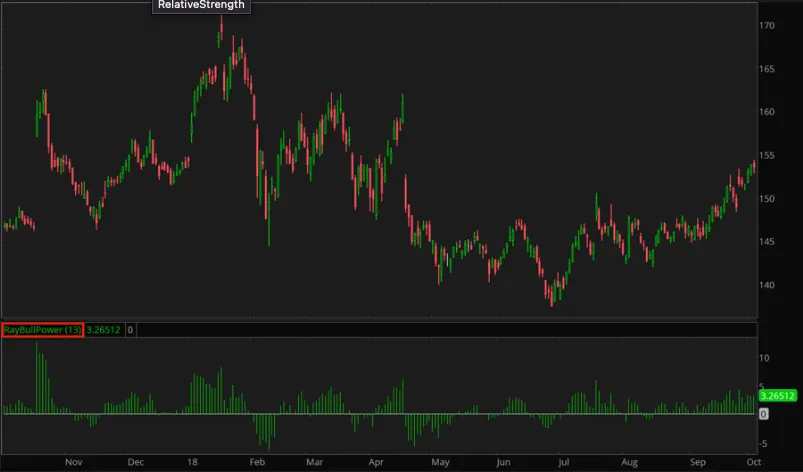
Ray Bull Power Study
TL;DR: The Ray Bull Power study plots only the Bull Power component of the Elder Ray indicator.
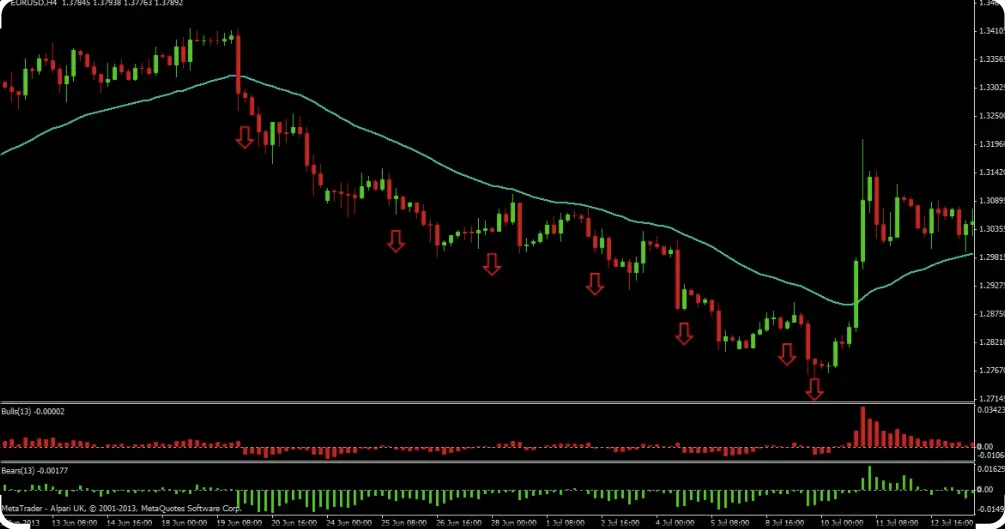
The Elder Ray Indicator
TL;DR: The Elder Ray indicator, developed in 1989, is designed to see through the market like an X-ray machine.
Bollinger Bands Divergence Strategy
TL;DR: The Bollinger Bands Divergence strategy is a trading system that uses a combination of well-known indicators and produces trade signals of all four types...
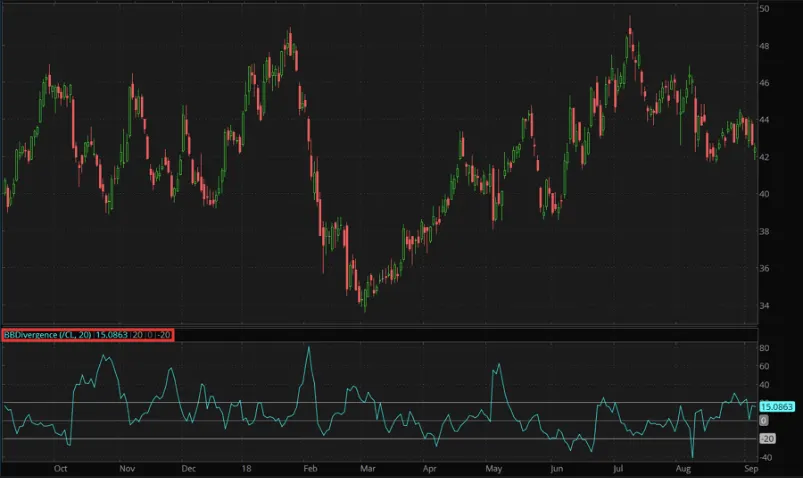
Bollinger Bands Divergence Study
TL;DR: The Bollinger Bands Divergence is a technical indicator that measures how much a stock or other asset is moving differently than a related market, like the overall stock market.
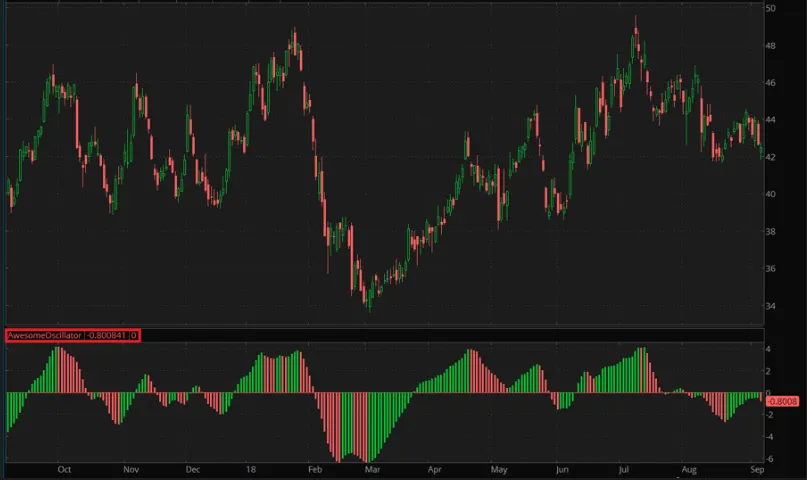
Awesome Oscillator Study
TL;DR: The Awesome Oscillator (AO) is a momentum indicator that compares a 5-day Simple Moving Average (SMA) to a 34-day SMA to predict potential market reversals.


What Is A Stress Test?
TL;DR: A stress test is a simulation of a worst-case scenario used to evaluate the resilience of a trading system or portfolio under difficult market conditions.

What Is Paper Trading?
TL;DR: Paper trading, also known as simulated trading, is the practice of buying and selling securities using virtual money through online brokerage platforms.
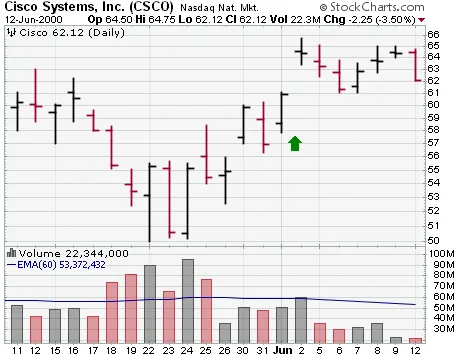
Gap Reversal LE Strategy
TL;DR: The Gap Reversal Long Entry strategy involves analyzing the size of gaps in stock prices to identify potential reversals.
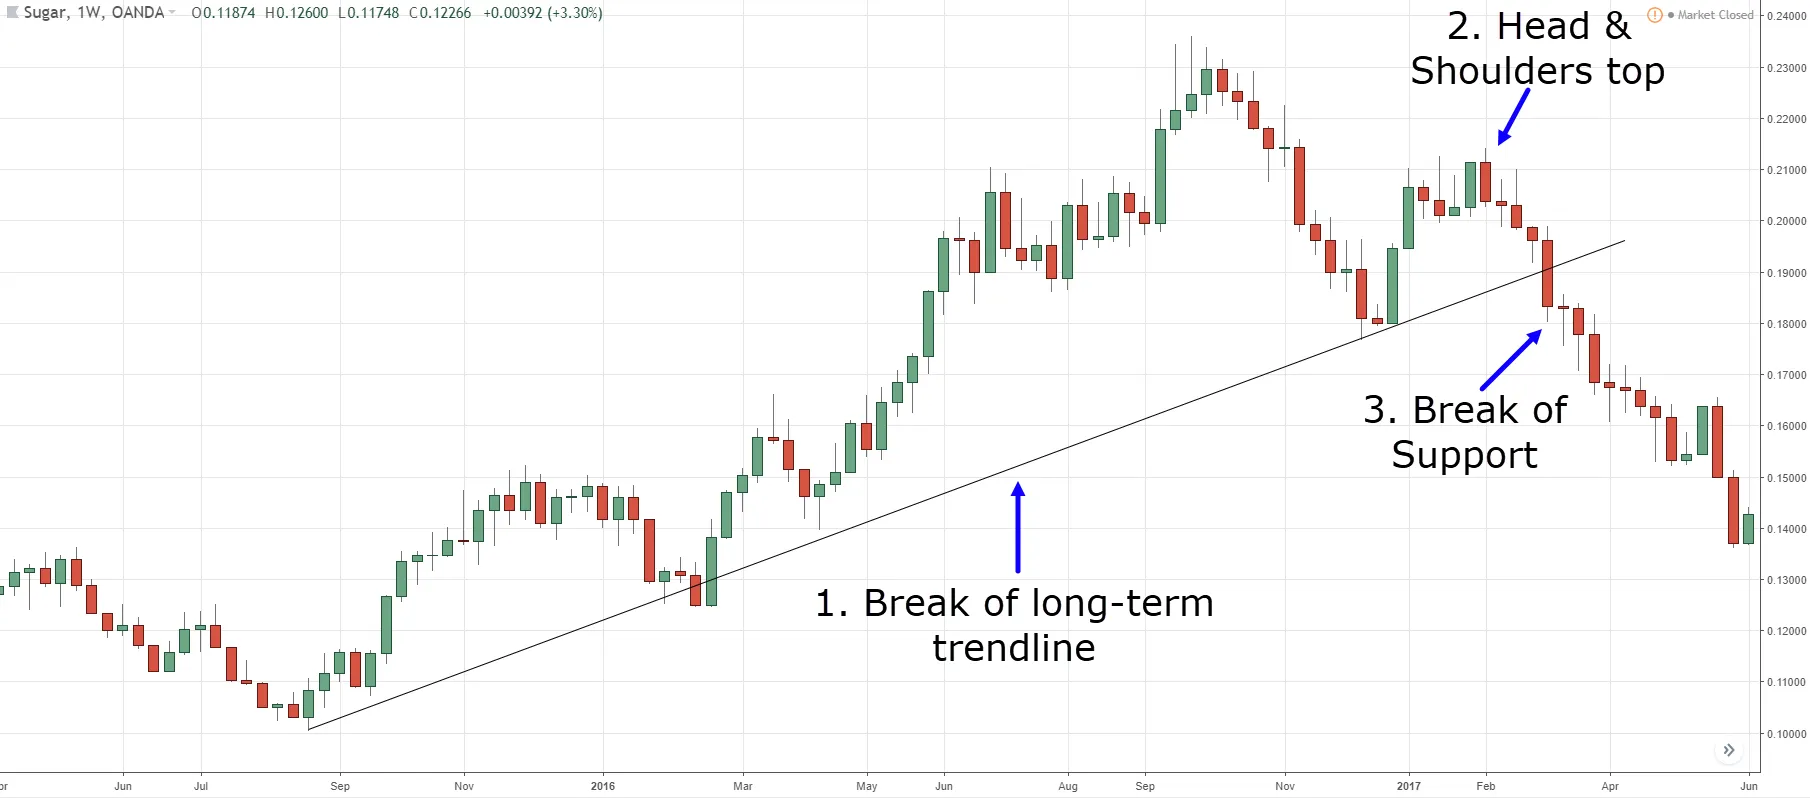
What Is Reversal?
TL;DR: A reversal in trading refers to a change in the direction of an asset's price trend.
Gap Up LE Strategy
TL;DR: The GapUpLE strategy generates a Long Entry signal when Gap Up occurs.
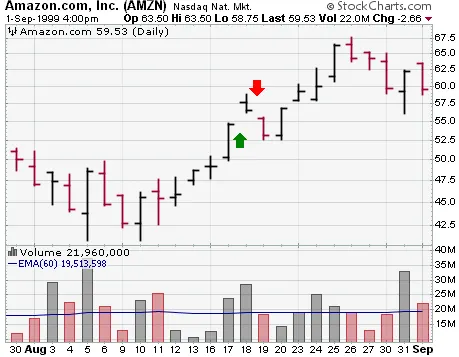
Gap Down SE Strategy
TL;DR: The Gap Down Short Entry strategy generates a Short Entry signal when Gap Down occurs.
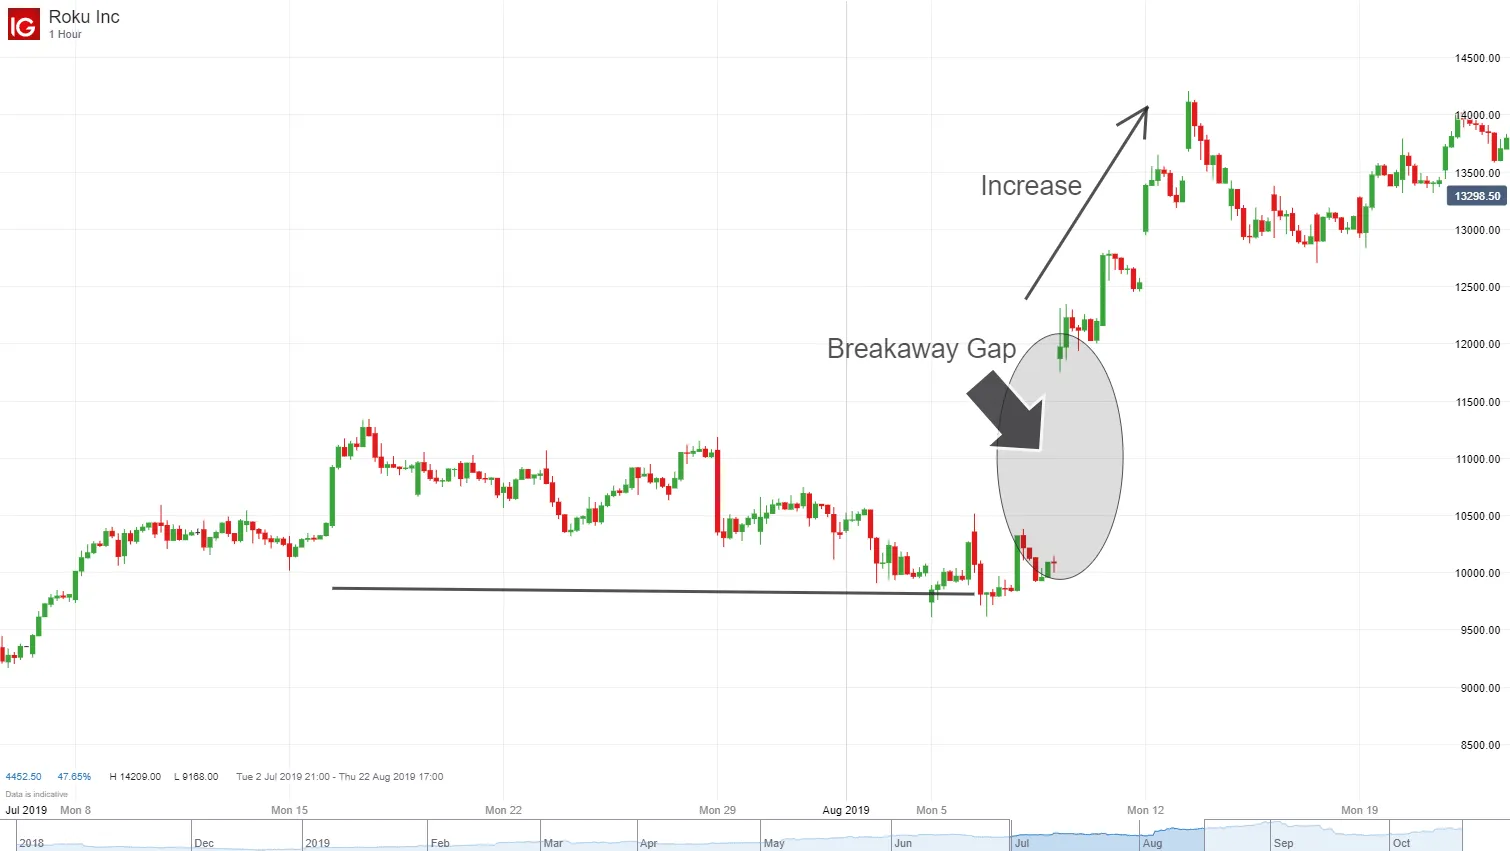
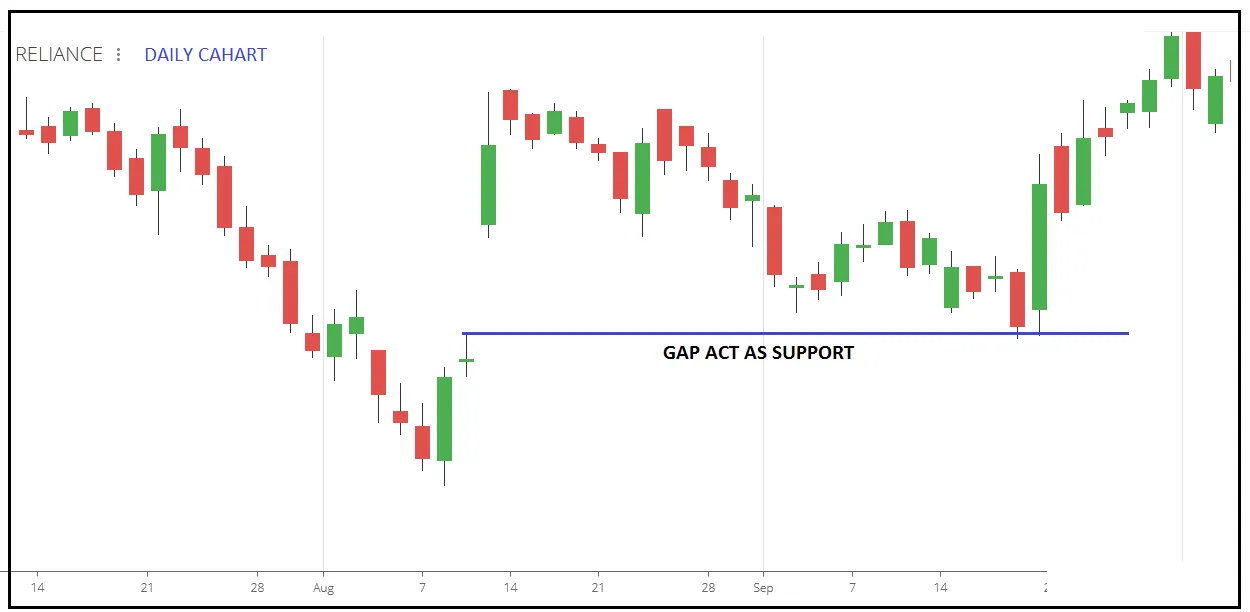
Trading The Gap
TL;DR: In trading, a gap is a change in price levels between the close and open of two consecutive days.
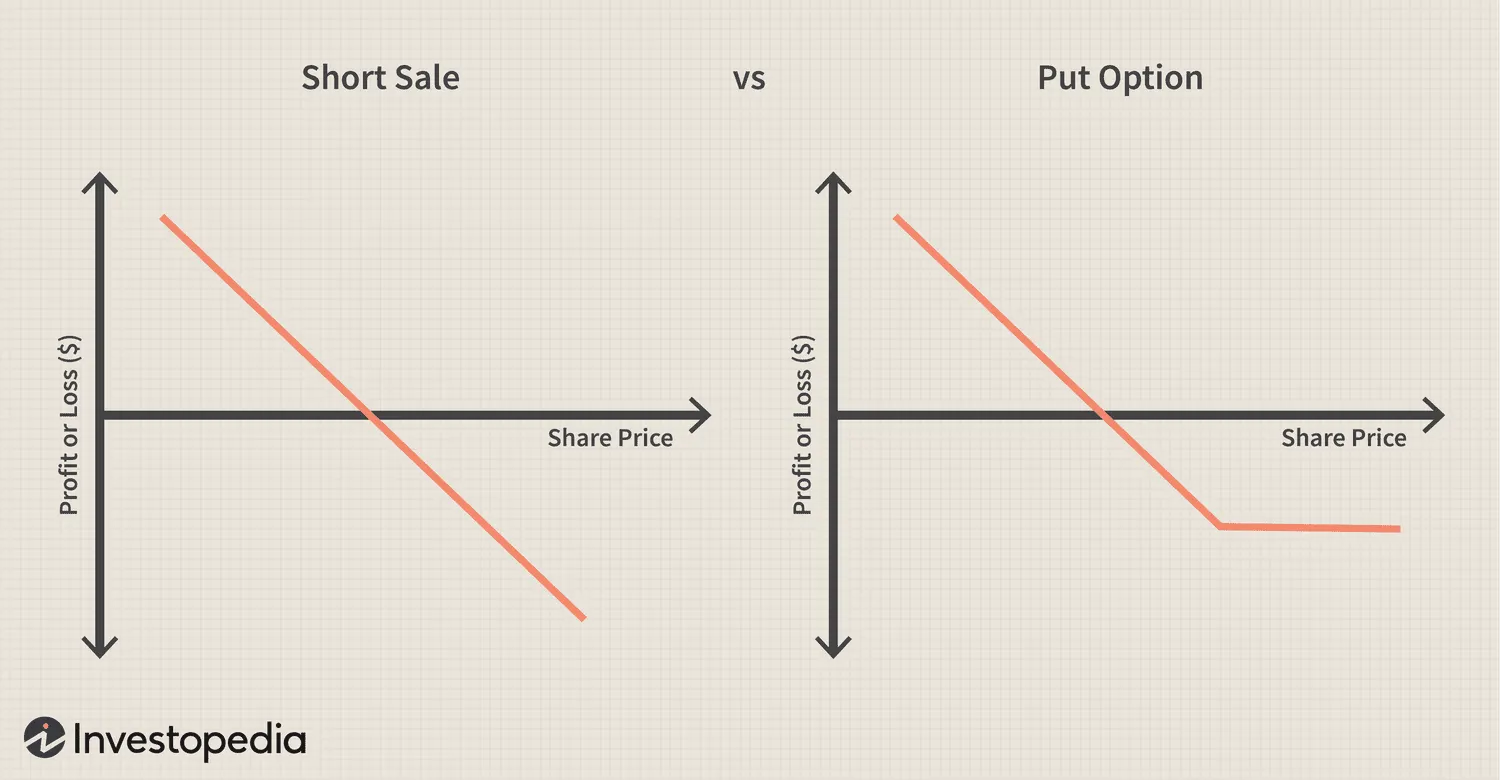
What Is A Put?
TL;DR: A put option is a financial instrument that allows the holder to sell a security at a predetermined price on or before a certain date.
Swing Three Strategy
TL;DR: The Swing Three Strategy is a swing trading system that uses technical indicators like SMAs and EMAs to determine entry and exit points for trades. It's best for...
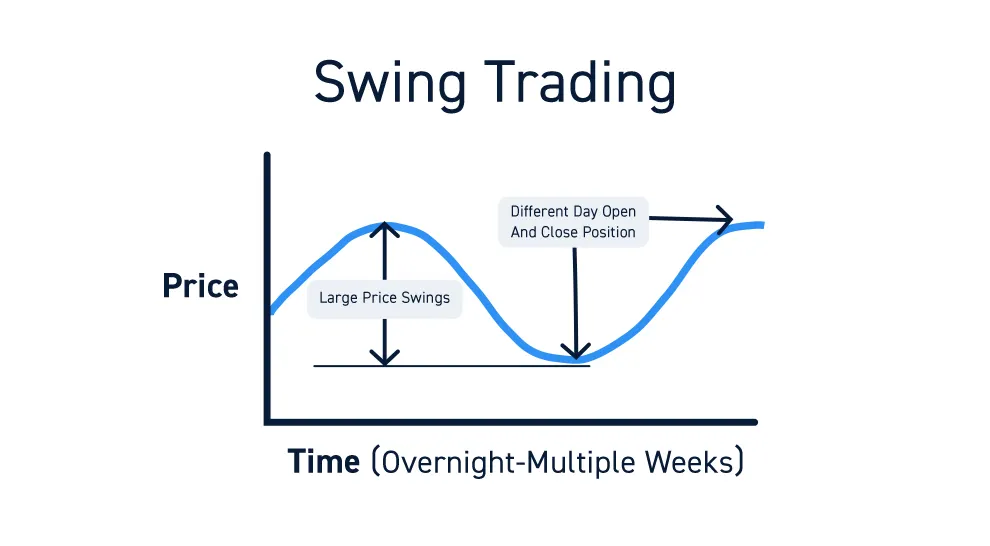
What Is Swing Trading?
TL;DR: Swing trading is a short-term trading strategy that involves holding a security for a few days to a few weeks in order to profit from price swings. The best stocks for swing trading are...
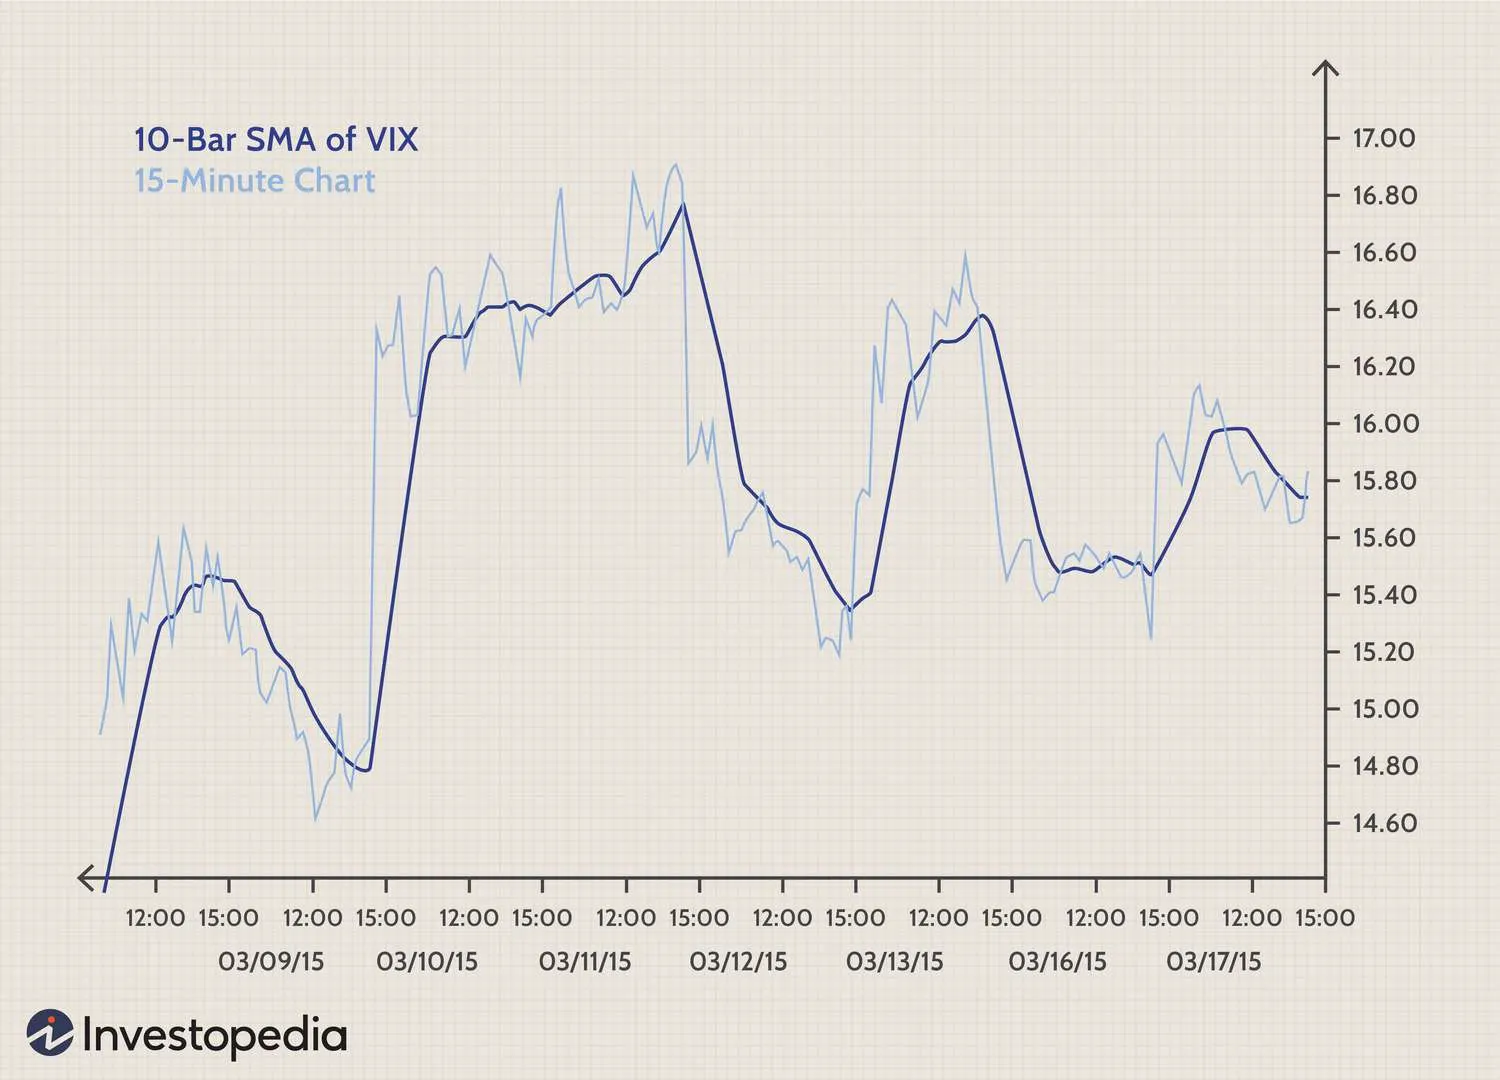
VIX Timing Strategy
TL;DR: The VIX Timing strategy is a forecasting tool that uses the Chicago Board Options Exchange Market Volatility Index (VIX) to indicate buying or selling opportunities for broad-based indexes.
What Are Option Premiums?
TL;DR: The option premium is the price that an investor pays for an option contract, which gives the holder the right to buy or sell a security at a predetermined price on or before a certain date.

What Is Premium?
TL;DR: In finance, premium can refer to the amount by which a security trades above its face value, the amount paid for an option above its intrinsic value, or...
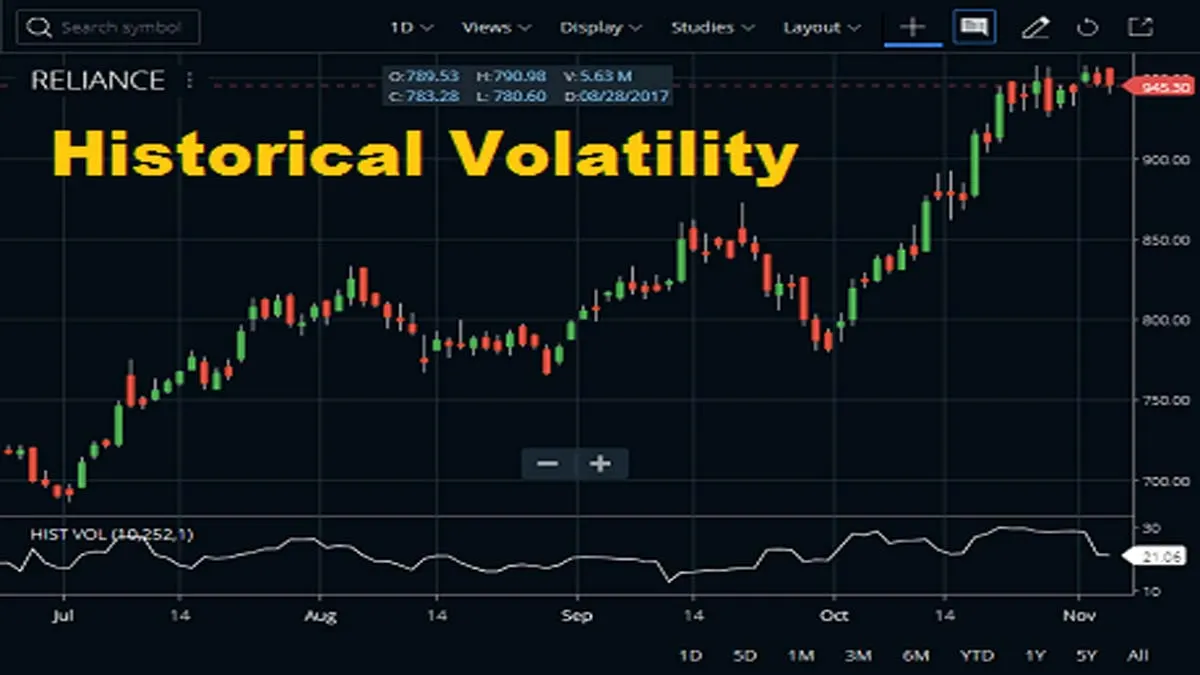
What Is Historical Volatility?
TL;DR: Historical volatility is a measure of the fluctuation in the price of a security over a given period of time, often used by investors to assess risk.
What is Underlying?
TL;DR: The underlying refers to the asset that an investment is based on, such as a company in the case of stocks or a basket of assets in the case of an ETF.
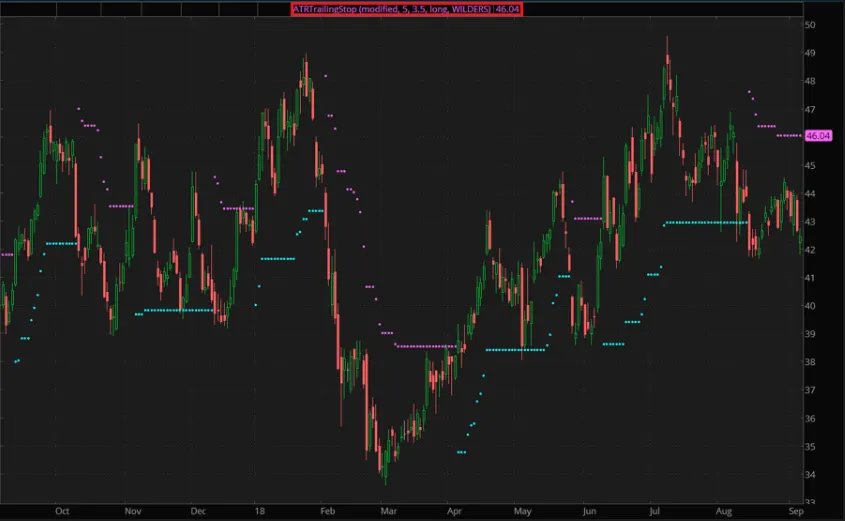
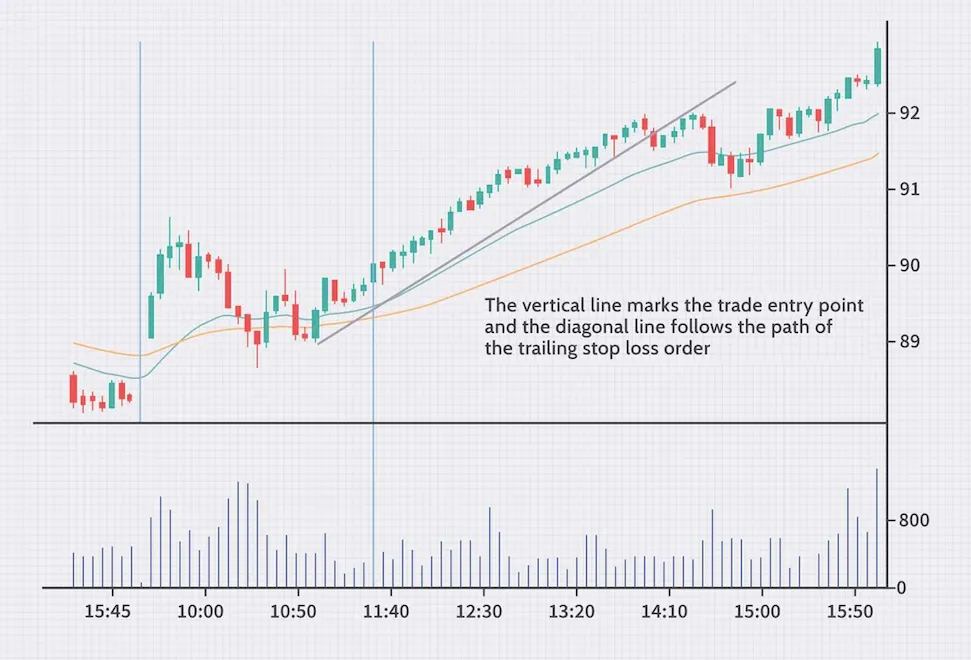
ATR Trailing Stop Study
TL;DR: ATR Trailing Stops are a way of using the Average True Range (ATR) indicator to set trailing stop-losses in order to exit positions or signal entries in conjunction with a trend filter.
Weighted Close Study
TL;DR: The Weighted Close indicator is a technical analysis tool that takes the average of the close, high, and low prices, with the close price being given more weight in the calculation.
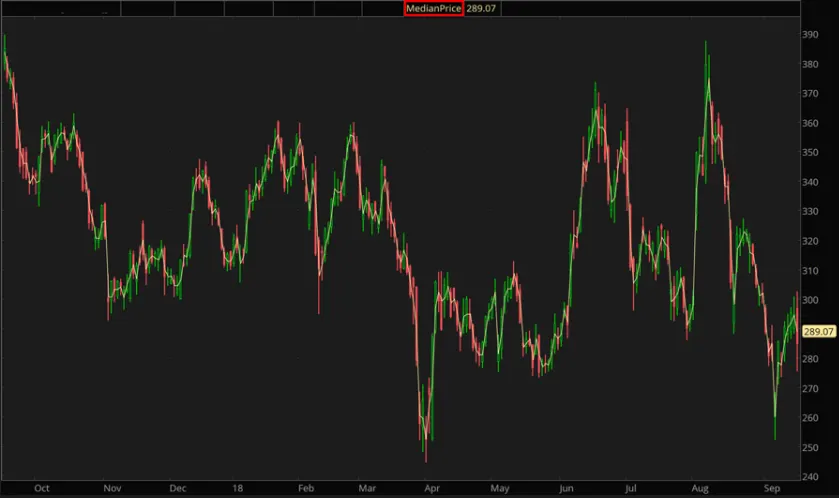
Median Price Study
TL;DR: The Median Price study is the midpoint of each day's price, or the “average price”.
Average True Range Study
TL;DR: The Average True Range (ATR) is a technical analysis indicator that measures market volatility. It is calculated as a moving average of the True Range, which takes into account the...

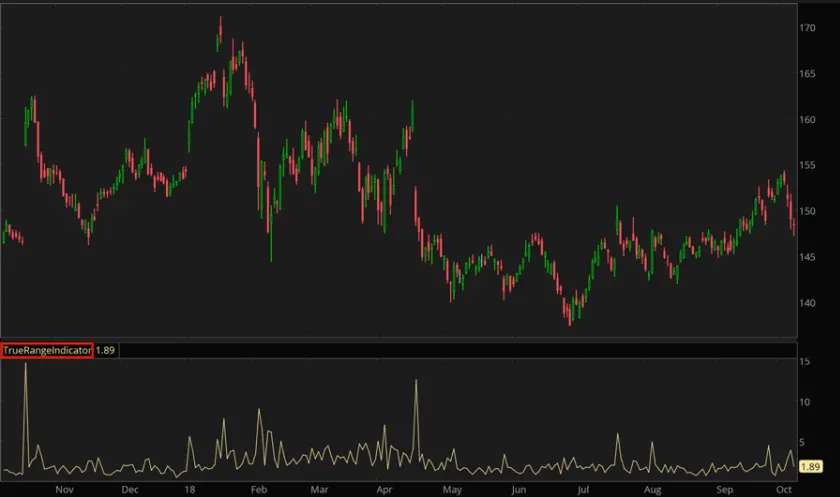
True Range Indicator Study
TL;DR: The True Range indicator is a measure of market volatility that takes into account the gap between the current high and low, as well as the previous close.
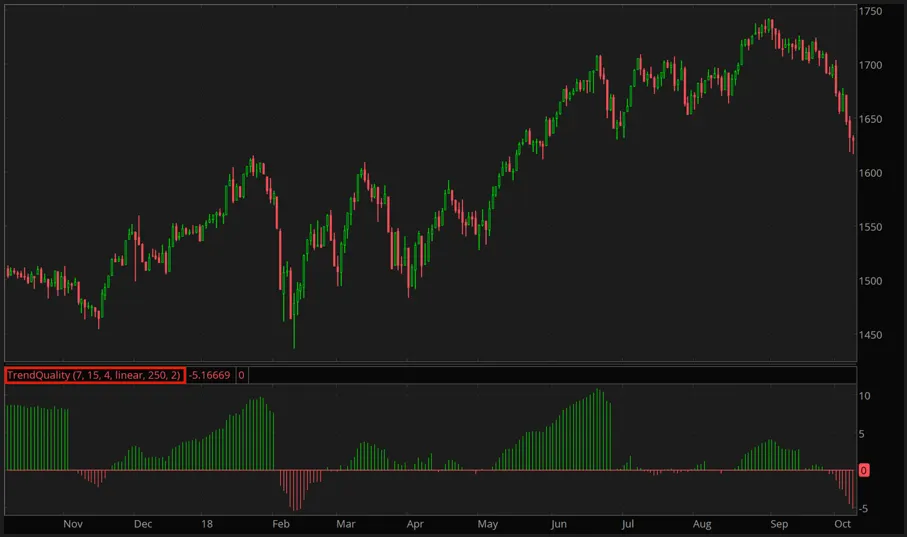
Trend Quality Study
TL;DR: The Trend Quality study is a trend-analyzing indicator that evaluates the strength of important trends by plotting a histogram showing the ratio of trend to noise. It can help...
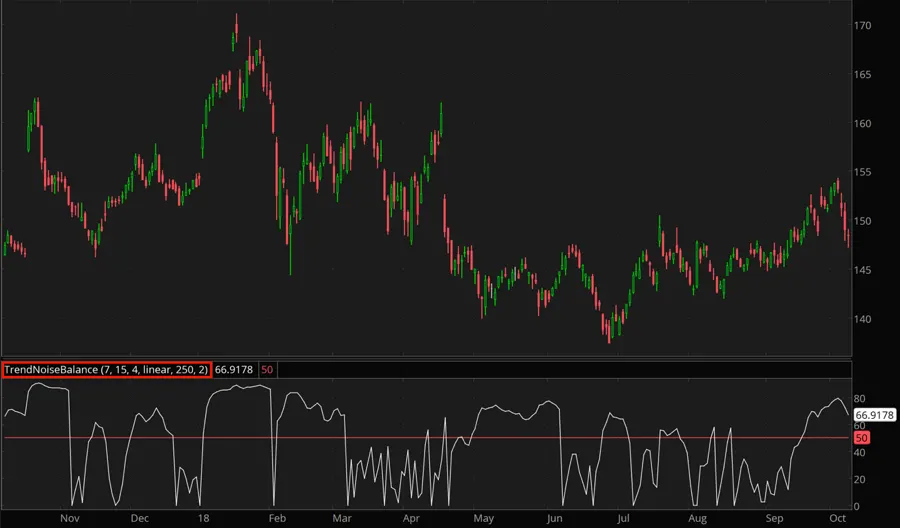
Trend Noise Balance Study
TL;DR: The Trend-Noise Balance study is a technical indicator that compares trend strength to noise in prices and is based on the cumulative price change.
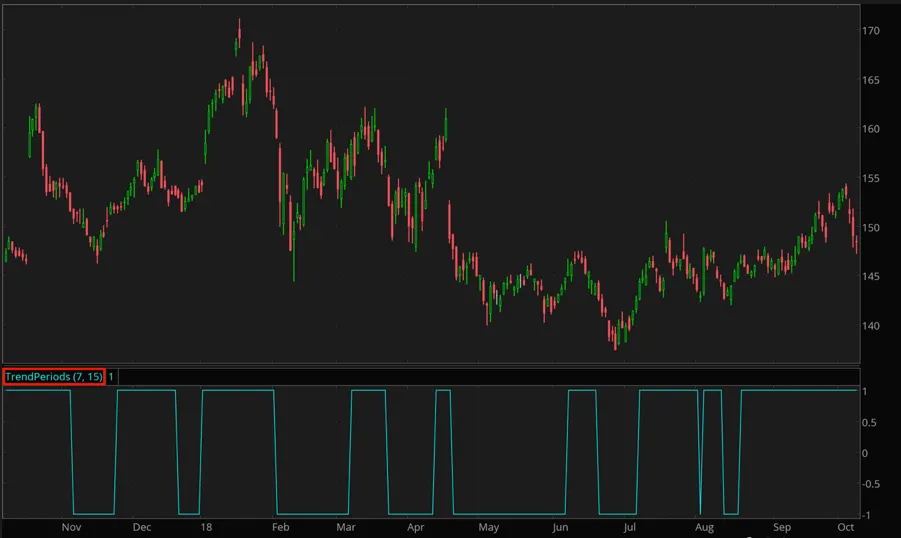
Trend Periods Study
TL;DR: The Trend Periods study analyzes trends by determining the algebraic sign of the difference between two Exponential Moving Averages. It is used to calculate the...
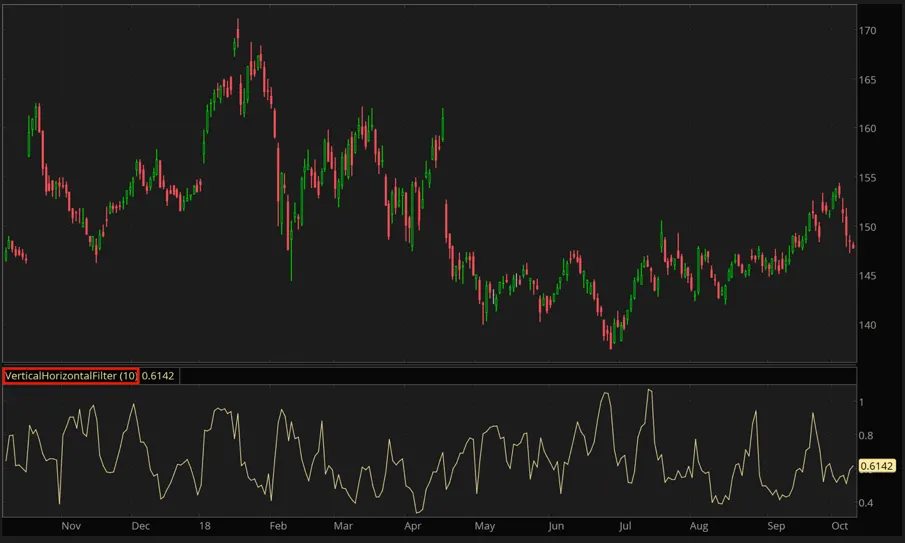
Vertical Horizontal Filter Study
TL;DR: The Vertical Horizontal Filter (VHF) is an indicator that measures trend activity and can help determine whether to use trend or momentum indicators for trading.
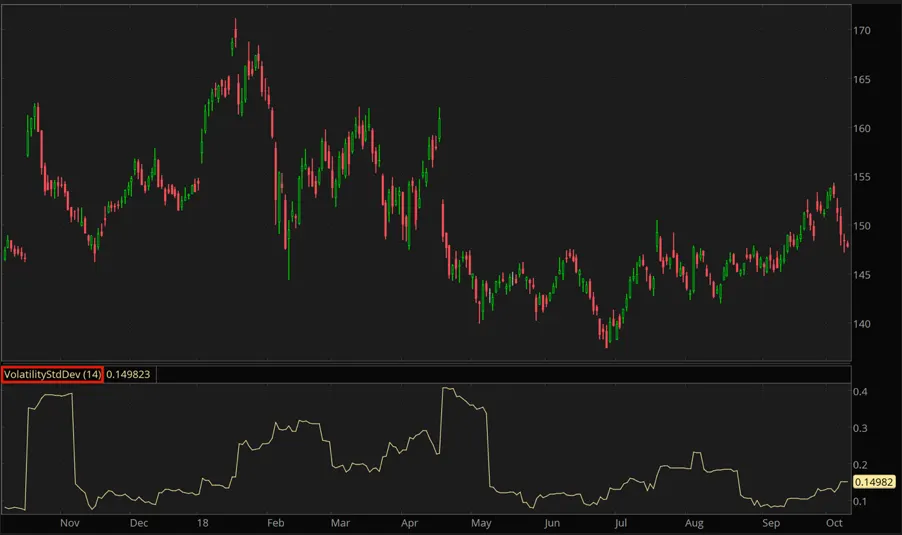
Volatility Standard Deviation Study
TL;DR: The Volatility Standard Deviation study calculates the...
Variable Moving Average
TL;DR: The Variable Moving Average is an Exponential Moving Average that adjusts its sensitivity based on market volatility to provide more accurate signals for both short and long-term markets.
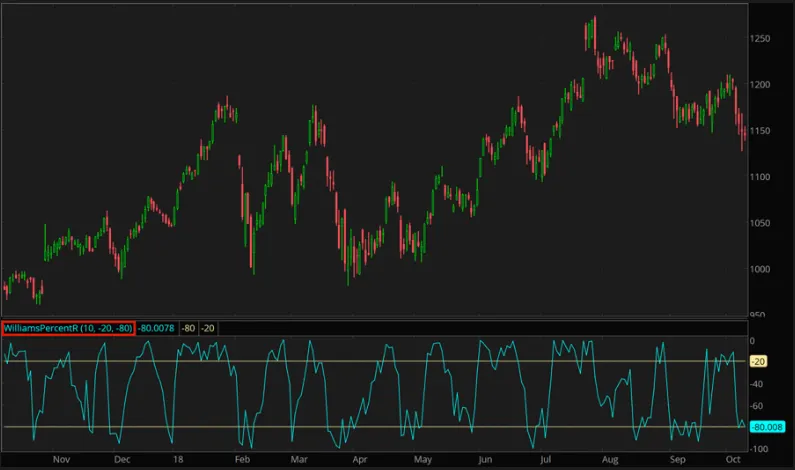
Williams Percent R
TL;DR: The Williams Percent R (%R) study is a momentum indicator that measures overbought and oversold levels by comparing a security's closing price to the high-low range over a specified period.
Percent R Study
TL;DR: The %R study is an oscillator that normalizes the price of a security to a 0-100 range based on the highest and lowest prices over a period of time. The Overbought and Oversold levels are...
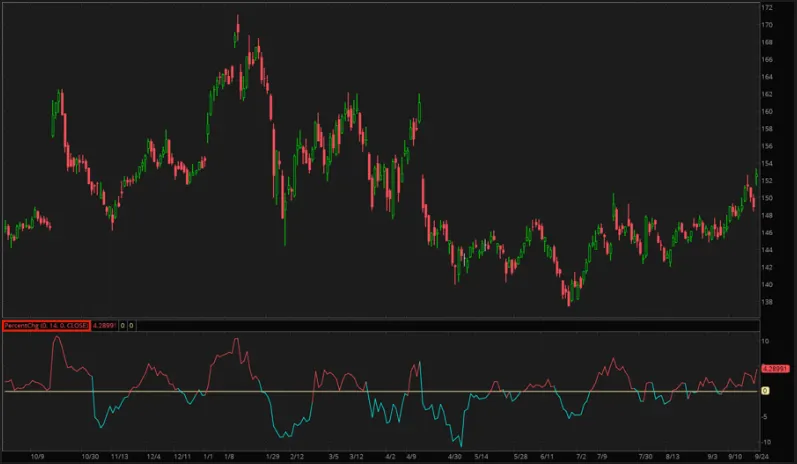
Percent Change Study
TL;DR: The Percent Change Study is a technical indicator that calculates the change in the price of a security over a period of time as a percentage of its past price. The formula for...

Chaikin Volatility Study
TL;DR: The Chaikin Volatility study is a technical indicator that predicts trend reversals based on changes in volatility. It is calculated as the...

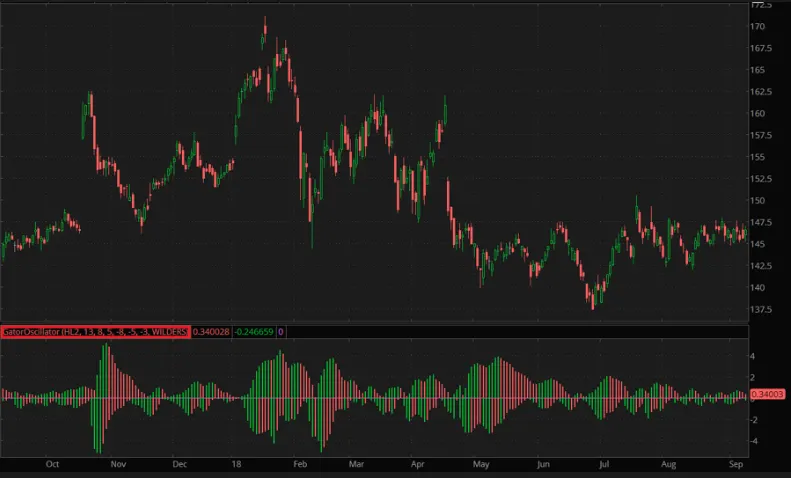
Gator Oscillator Study
TL;DR: The Gator Oscillator is an indicator used to help determine market trends and determine when to enter and exit trades.
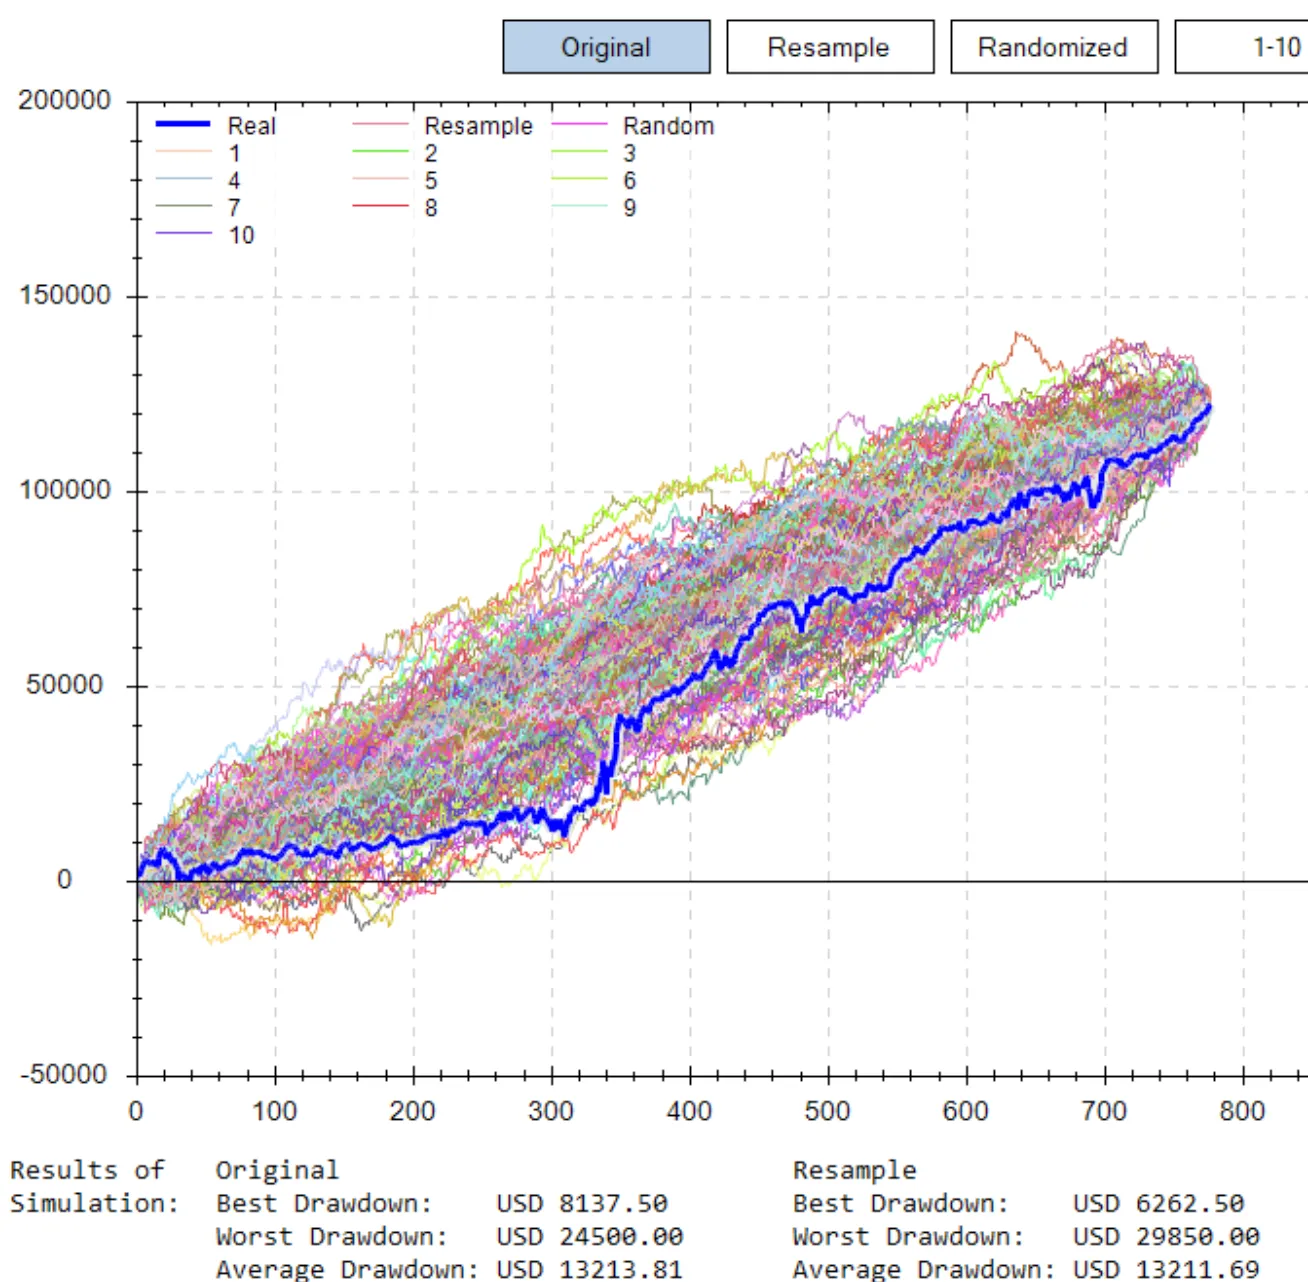
How To Stress Test A Trading Strategy
In this blog, we'll go over some simple but effective ways to stress test your strategy, so you can have greater confidence in its performance.

The Top 10 "Free" Backtesting Tools
In this blog, we'll be showcasing the top 10 free backtesting tools that are currently available.
Williams Alligator Study
TL;DR: The Williams Alligator Study is a trading strategy developed by Bill Williams that is based on the idea that financial markets and individual stocks trend only 15-30% of the time, while...
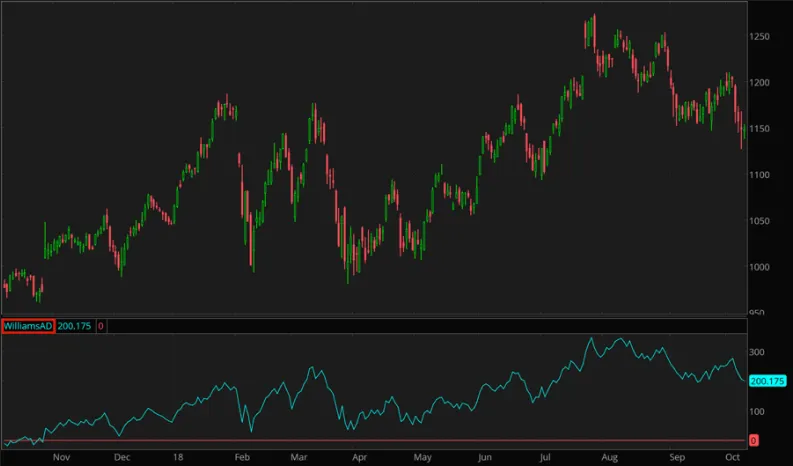
Williams AD Study
TL;DR: The Williams AD study identifies when accumulation and distribution are taking place for a security. This means...


How To Use A Benchmark
You are considering investing in a new stock and want to determine if it is a good investment.
What Is A Benchmark?
A benchmark is a standard by which something is measured or judged. In trading, benchmarks are used to compare the performance of a financial instrument or portfolio.
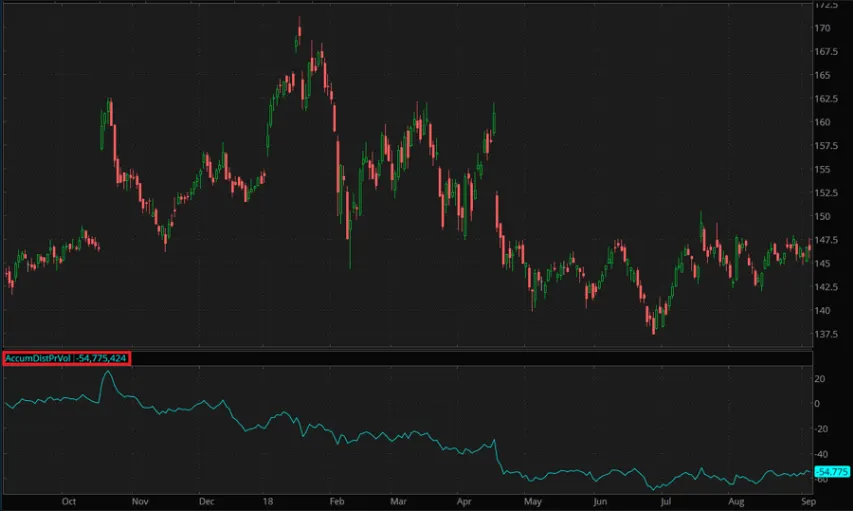
Accumulation/Distribution Pressure Volume Study
TL;DR: The Accumulation/Distribution Pressure Volume study uses the price and volume of a security to assess the trend strength and identify points of divergence. These points...
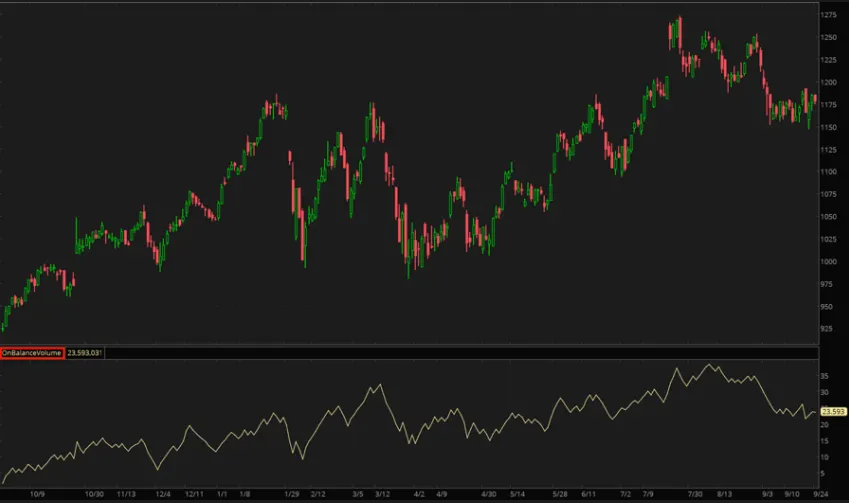
On-Balance Volume Study
TL;DR: The On-Balance Volume calculates a running total of the volume going into and coming out of a security. It can be used to...
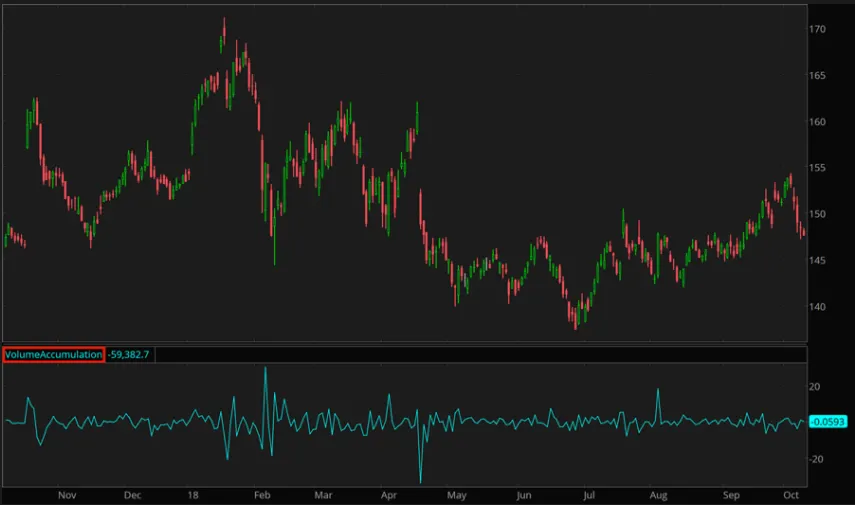
Volume Accumulation Study
TL;DR: The Volume Accumulation study calculates volume multiplied by the difference between the close price and the midpoint of the bar's range. This value plot can be used to...
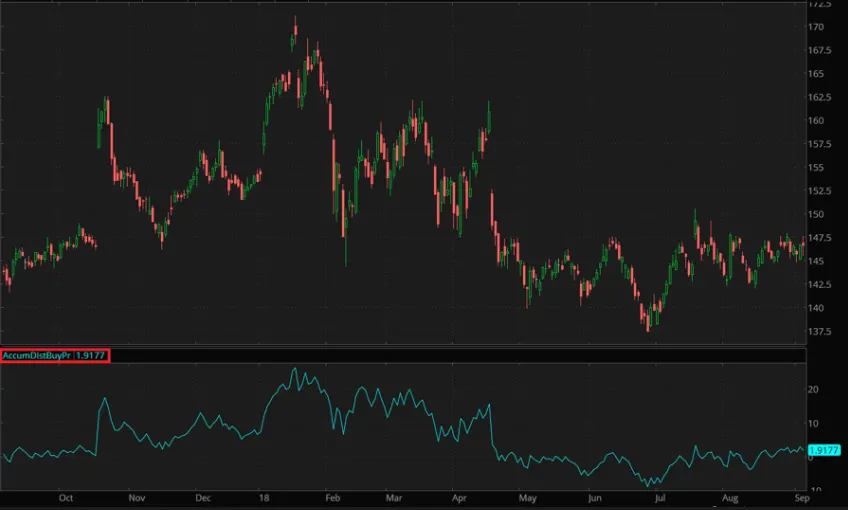
Accumulation Distribution Buying Pressure Study
TL;DR: The Accumulation/Distribution Buying Pressure study assesses the strength of current trends and signals possible trend reversals. The value is found by calculating...
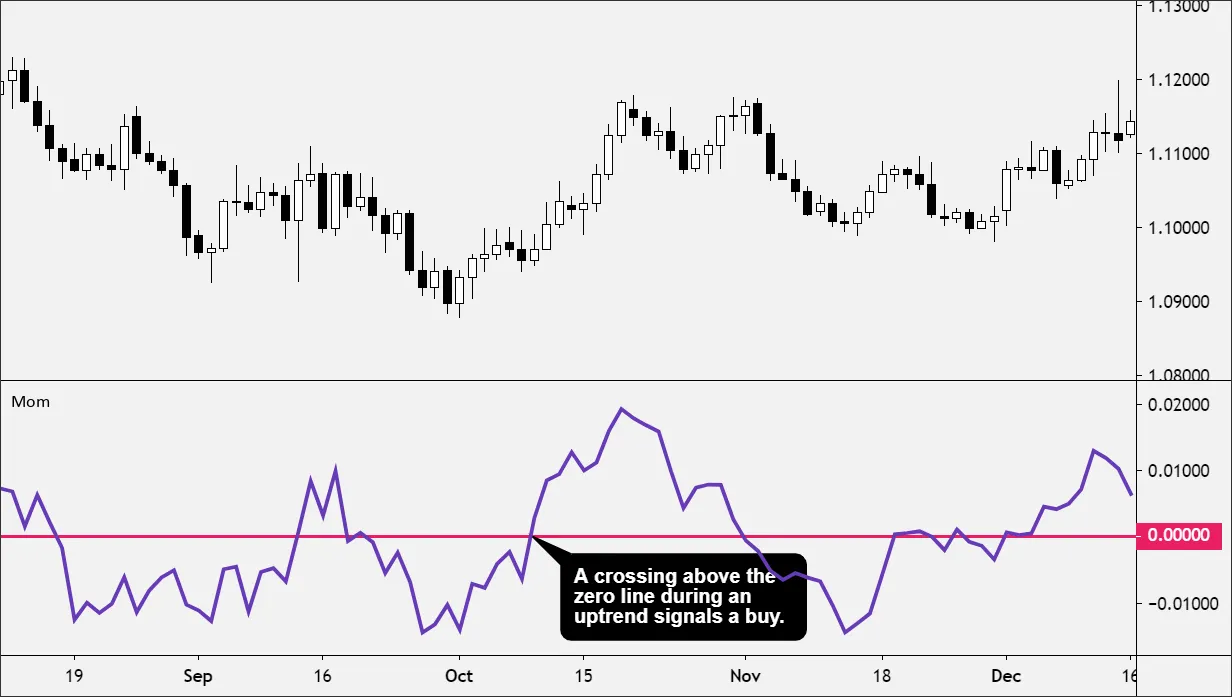
Momentum Long Entry Strategy
TL;DR: The Momentum Long Entry strategy calculates momentum as the velocity of change in price over a specified number of days. The Long Entry signal is triggered when...
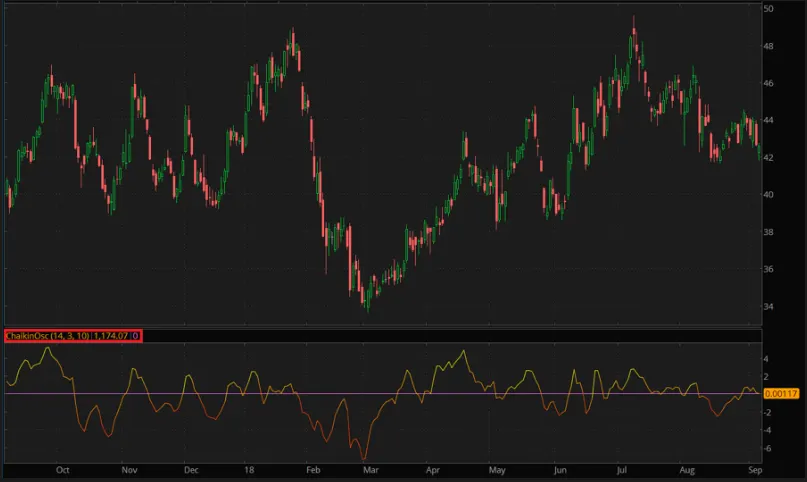
Chaikin Oscillator Study
TL;DR: The Chaikin Oscillator is a technical indicator used to find directional trends in momentum. It is calculated as the difference between two EMAs of Accumulation/Distribution values...
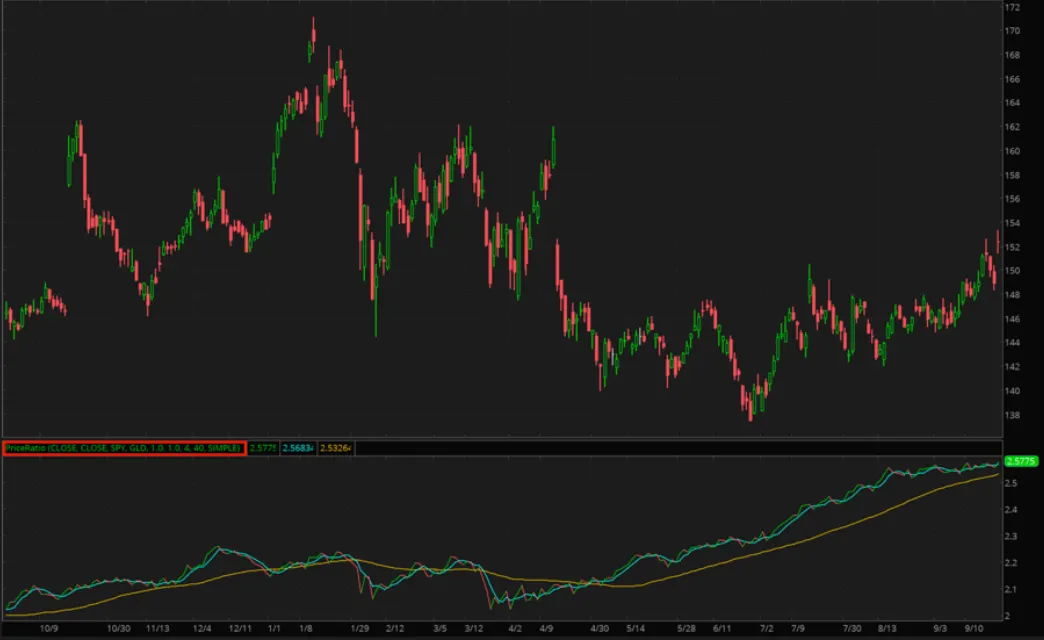
Price Ratio Study
TL;DR: The Price Ratio study is used to compare the price between two securities of your choosing. When the ratio grows, the plot is displayed in green, otherwise it is...
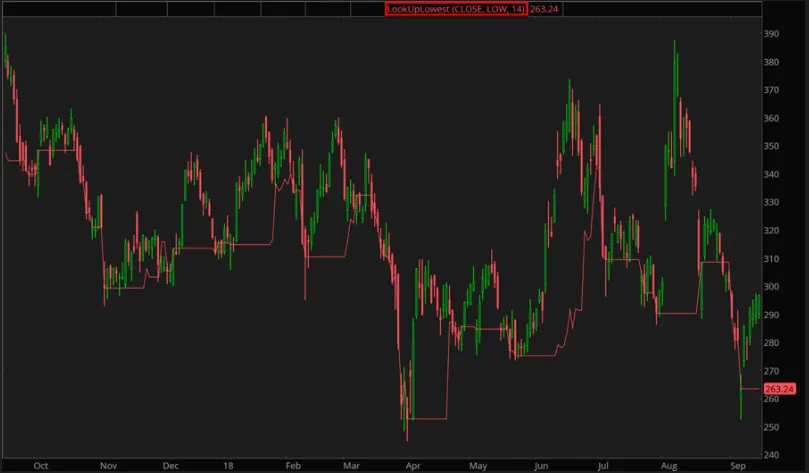
Look Up Lowest Study
TL;DR: The Look Up Lowest study finds the lowest close price of security over a 14-day time period. These variables can be adjusted for your investment needs. For example...
Look Up Highest Study
TL;DR: The Look Up High study returns the highest close price of a security over the last 14 days. Note, these variables can be changed based on your investment needs. For example...
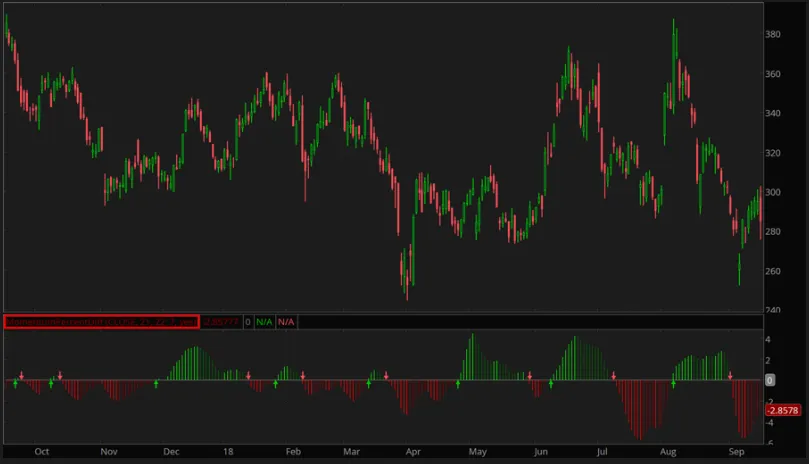
Momentum Percent Difference Study
TL;DR: The Momentum Percent Difference analyzes the percent difference between the current and past value of a Simple Moving Average. The difference is plotted on a histogram. Histogram crossovers...
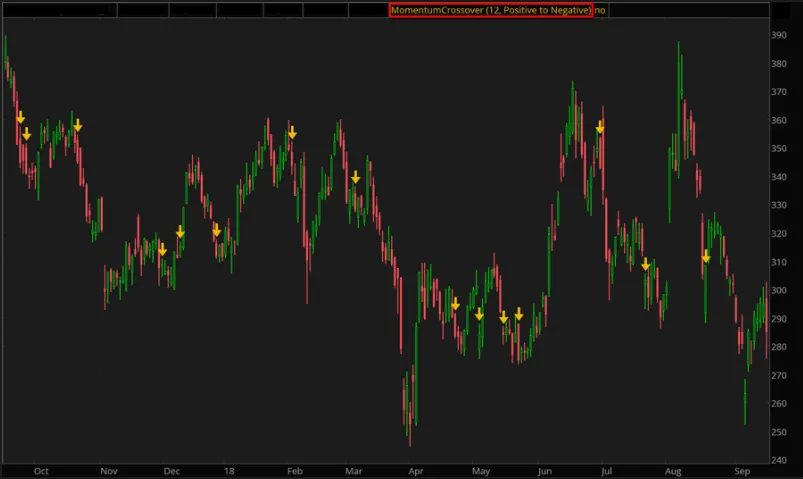
Momentum Crossover Study
TL;DR: The Momentum Crossover study finds where Momentum crosses the zero line.
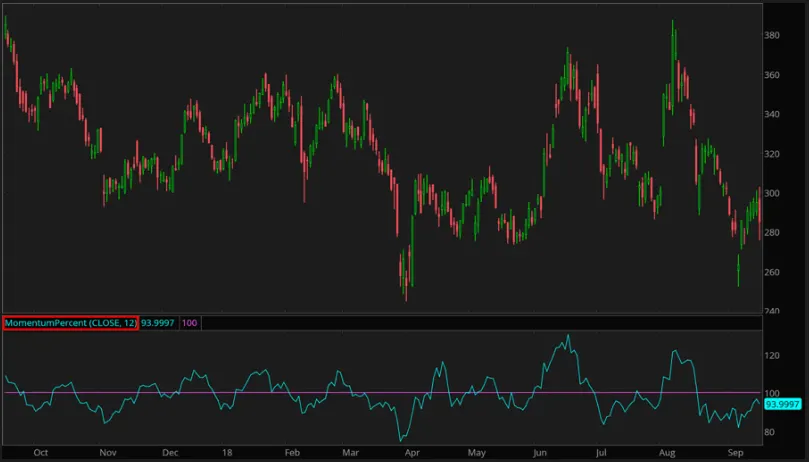
Momentum Percent Study
TL;DR: Consider the Momentum Percent study an oscillator for Momentum. It normalizes and bounds momentum to a range of 0-100%. This makes it easier to compare current price changes to...
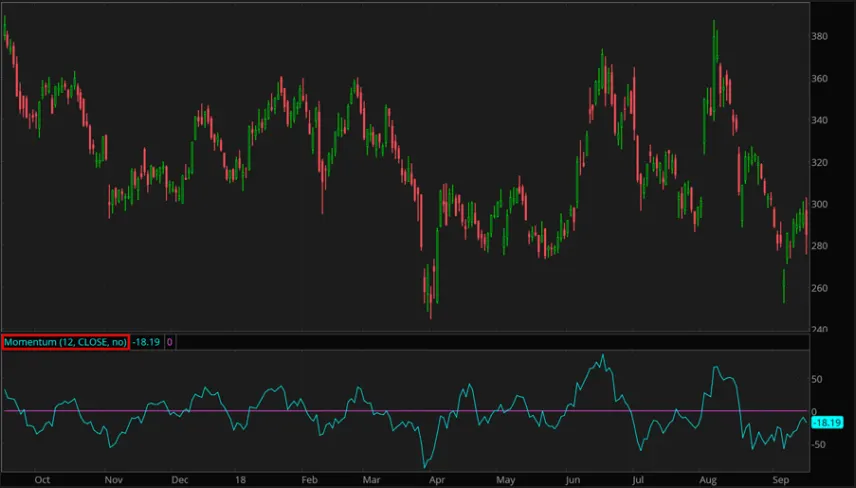
Momentum Study
TL;DR: The Momentum Study measures the speed at which a security’s price is moving in a certain direction. The goal with momentum trading is to...
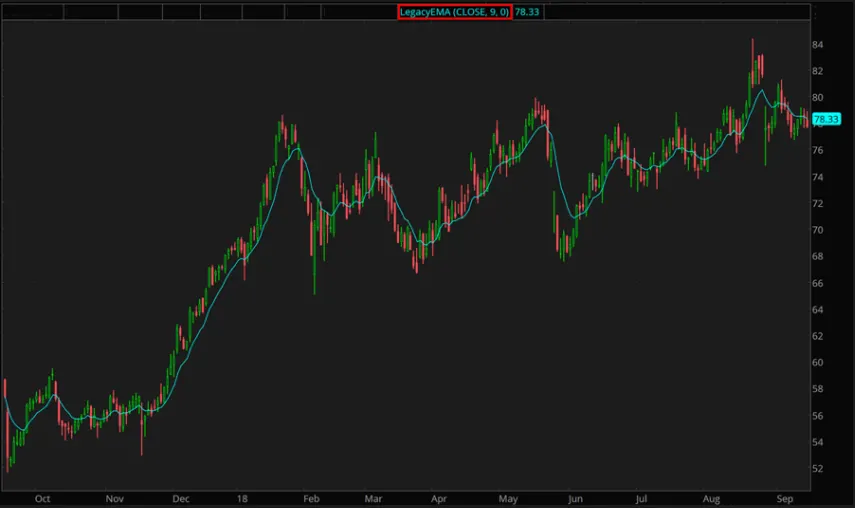
Legacy EMA Study
TL;DR: The Legacy EMA study is range-dependent because it lacks the prefetching mechanism used by the updated EMA. The initialization point for Legacy EMA is the specified price of the first bar.
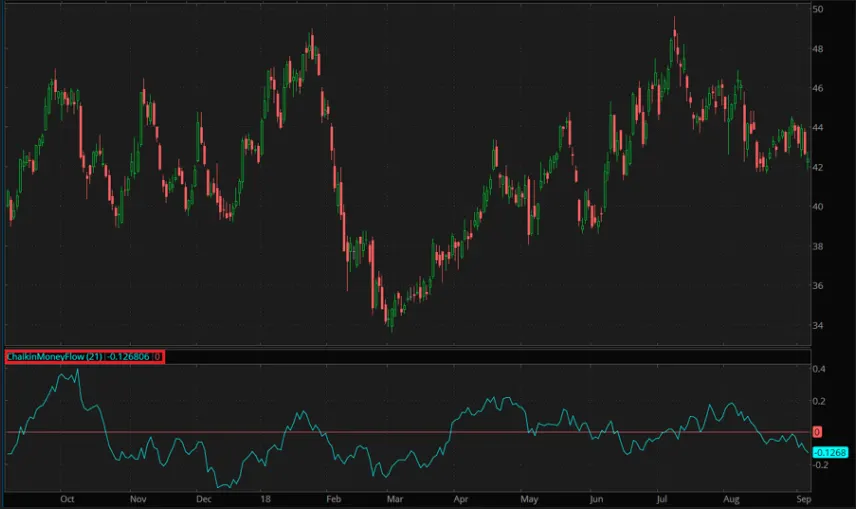
Chaikin Money Flow Study
TL;DR: The Chaikin Money Flow is a volume-weighted average of accumulation and distribution over a specified period. The principle behind the Chaikin Money Flow is...
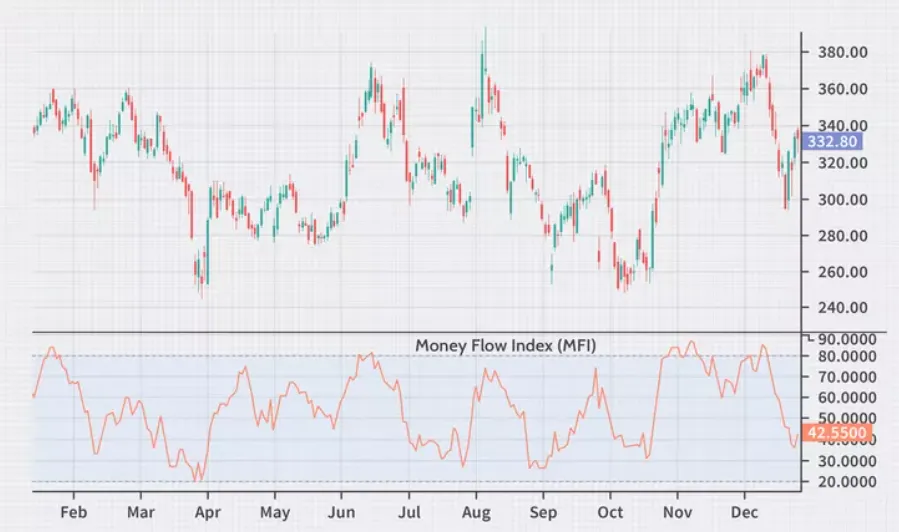
Money Flow Index Study
TL;DR: The Money Flow Index study assesses the money flowing into and out of a security to determine market trends and potential reversals. It does this by...
Money Flow Study
TL;DR: The Money Flow study is a measure of the inflows and outflows of money for a particular stock. Money Flow itself is not...
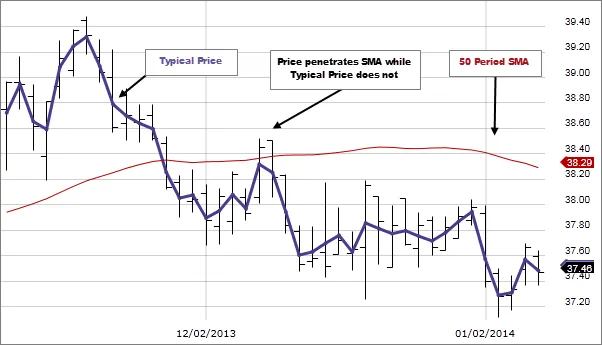
Typical Price Study
TL;DR: The Typical Price study plots the average of the high, low, and close prices for a security alongside a SMA. As the Typical Price crosses above the SMA this may indicate...
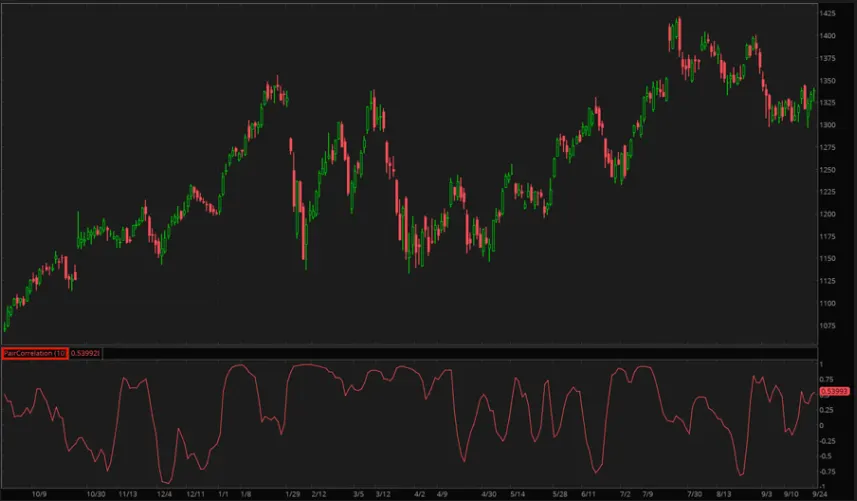
Pair Correlation Study
The Pair Correlation study calculates the Correlation coefficient between the prices of the securities in the composite symbol (e.g., "IBM+GOOG").
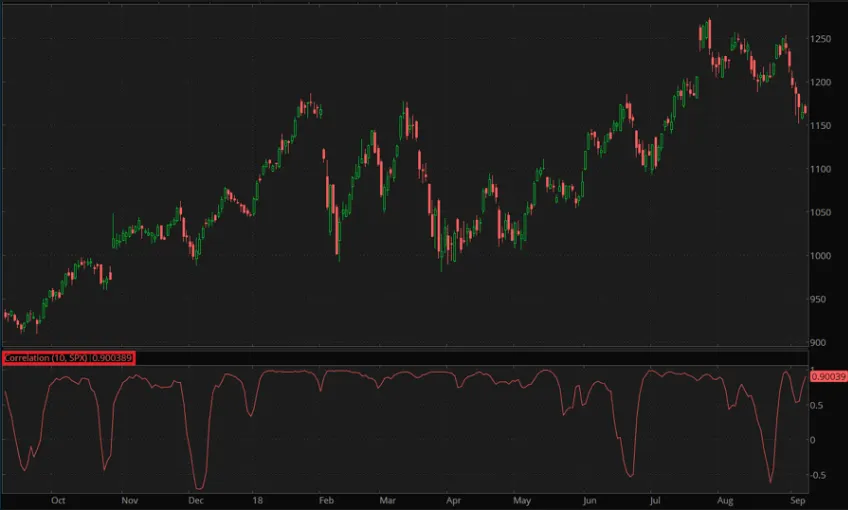
Correlation Study
TL;DR: The Correlation study assesses whether two financial securities have a linear relationship with each other. The correlation coefficient is calculated and varies on a scale of...
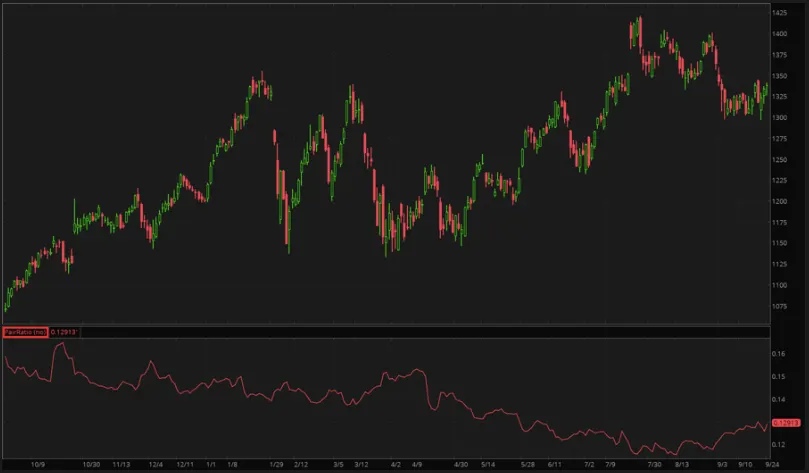
Pair Ratio Study
TL;DR: The Pair Ratio study is applied to composite symbols; it calculates the ratio of close price of the first security to that of the second one.
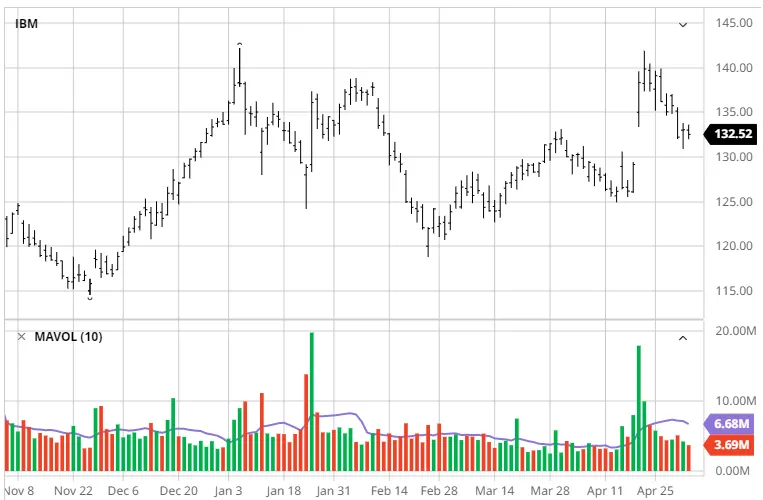
Volume Average Study
TL;DR: The Volume Average study plots volume and the Moving Average of volume.
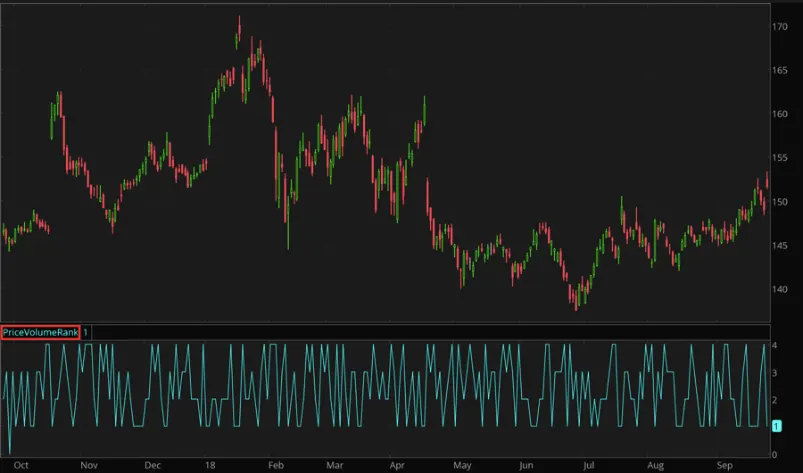
Price Volume Rank Study
TL;DR: The Price-Volume rank study compares a security’s close price and volume today, to the previous day’s values. Based on the increase/decrease in price and volume...

How to Set Up a TDA Account: A Step-by-Step Guide
Step 1: Start your application Start by navigating to TD Ameritrade's account application page. You'll fill out...
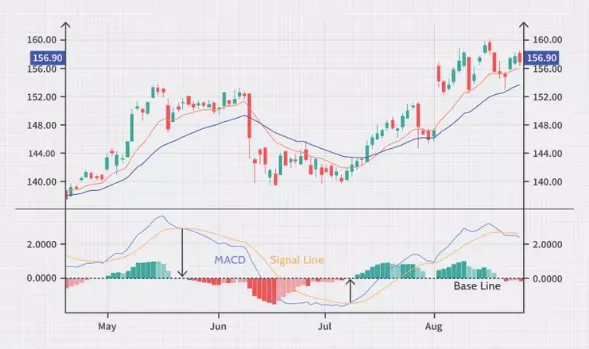
MACD Strategy
TL;DR: The MACD value is found by subtracting the 26-day Exponential Moving Average (EMA) from the 12-day EMA. A 9-day EMA of the MACD line is calculated and...
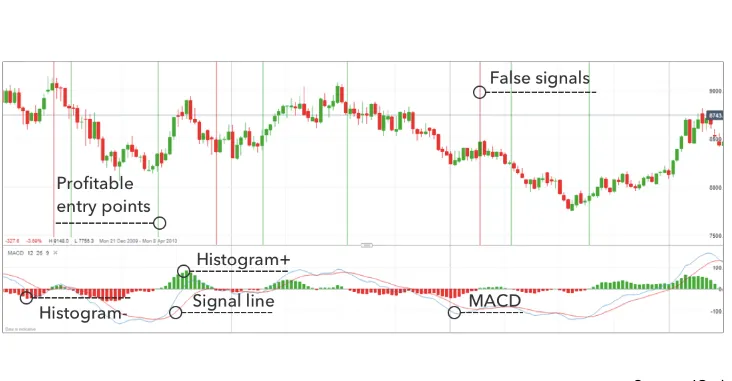
MACD Study
TL;DR: The MACD indicator plots the difference between two moving averages for a security. Its value indicates changes in the direction and the strength of a trend. Trade signals occur when...
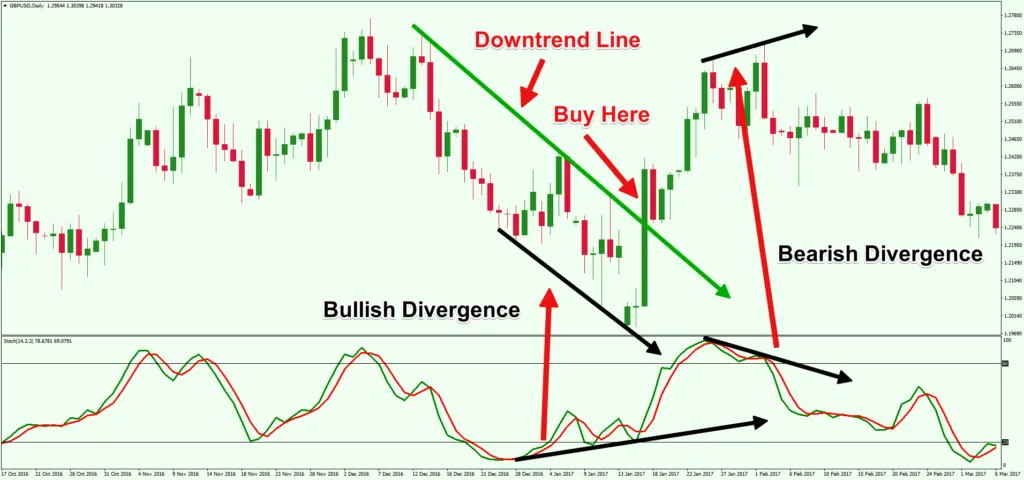
Stochastic Oscillator Strategy
TL;DR: The Stochastic Oscillator strategy adds simulated buy and sell orders to the more generalized Stochastic Full study. Because it is an oscillator, signals are given based on...
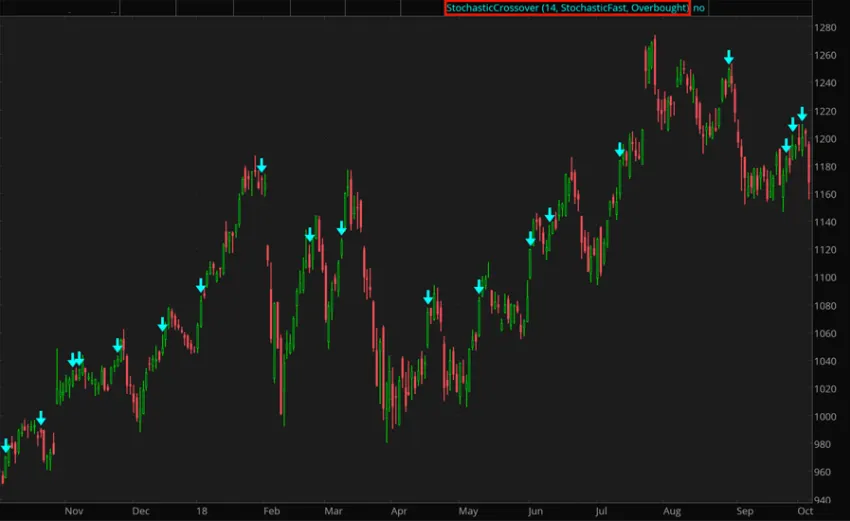
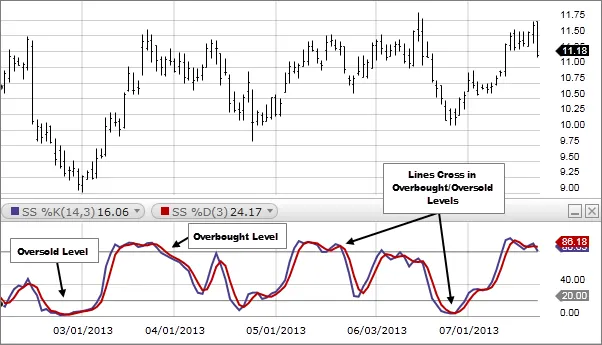
Stochastic Crossover Study
TL;DR: The Stochastic Crossover is a technical indicator based on the stochastic oscillator. It finds where either the Stochastic Slow or the Stochastic Fast value crosses the...
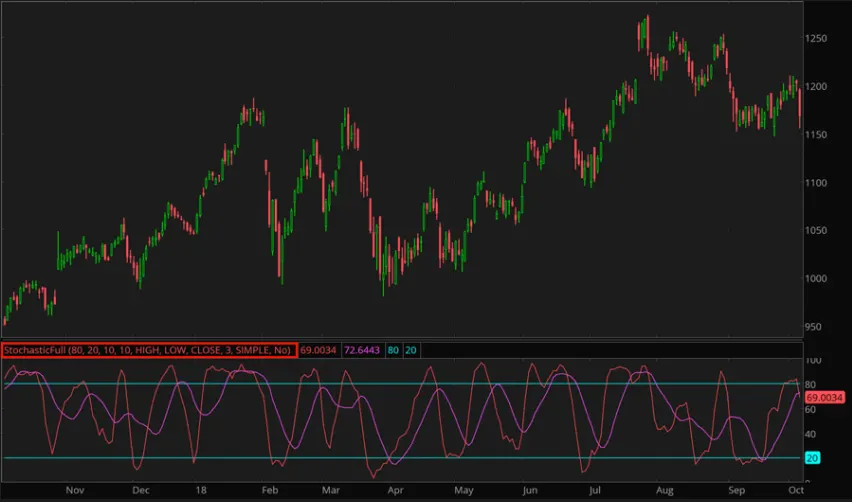
Stochastic Full Study
TL;DR: The Stochastic Full Study is a generalized version of the Stochastic Fast and Slow Studies, so the Stochastic Full value may be the same as either of those oscillators if you choose a...
Stochastic Oscillator (Slow) Study
TL;DR: The Slow Stochastic Oscillator is calculated by finding the 3-day SMA of the Fast Stochastic Oscillator value. In doing this, the Slow Stochastic is less sensitive to...
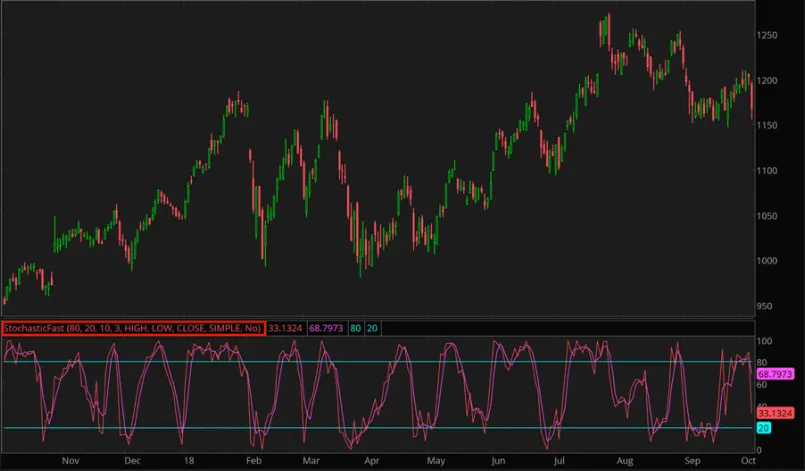
Stochastic Oscillator (Fast) Study
TL;DR: The Stochastic Fast study is based on the premise that a security’s price will be near an upper price range when it is overbought and it will approach a lower price range when...
What is an Oscillator?
TL;DR: The oscillator is a technical analysis tool that plots upper and lower bands around two extreme values. It then...
Displaced Exponential Moving Average Study
The Displaced Exponential Moving Average (DEMA) is a study calculating a moving exponential average and shifting it forward or backward in time for a specified period.
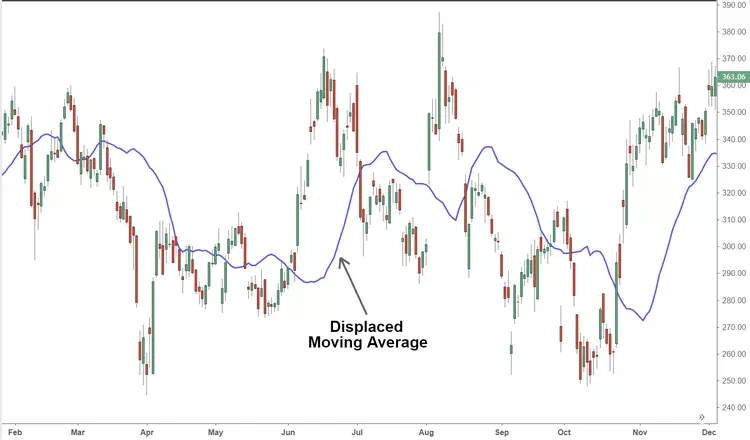
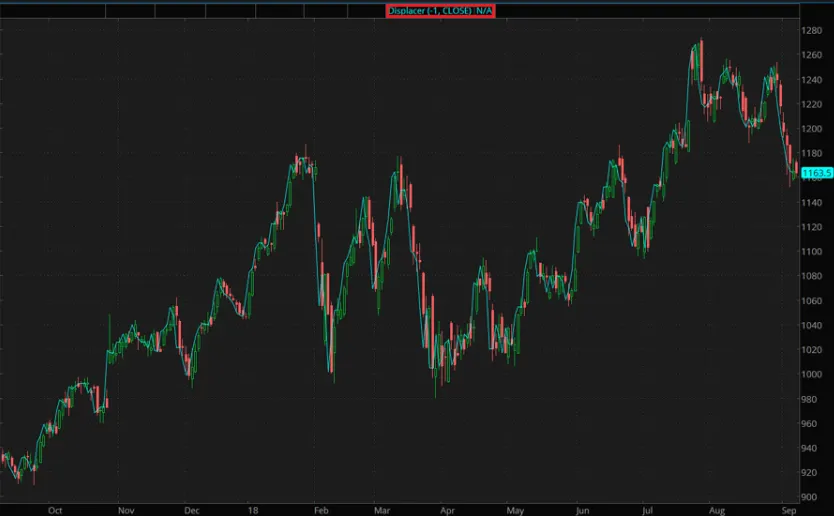
Displaced Moving Average Study
TL;DR: The Displaced Moving Average indicator is used to closely match the moving average with the price action. It is used to...
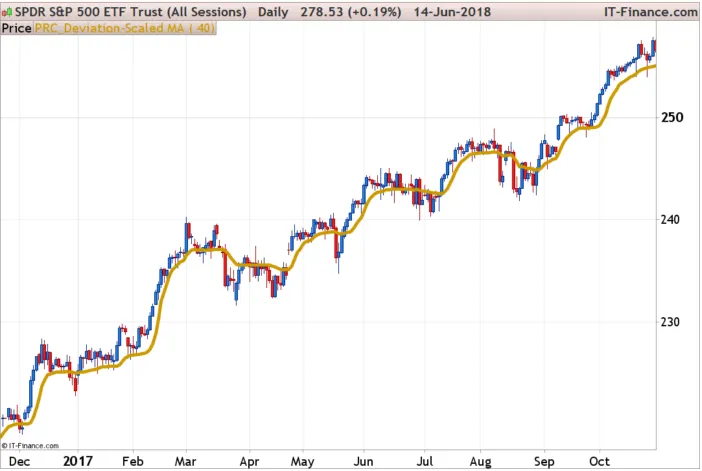
Deviation Scaled Moving Average Study
TL;DR: The Deviation Scaled Moving Average (DSMA) is an adaptive moving average that quickly adapts to price volatility. It utilizes the exponential moving average and the Super Smoother Filter.
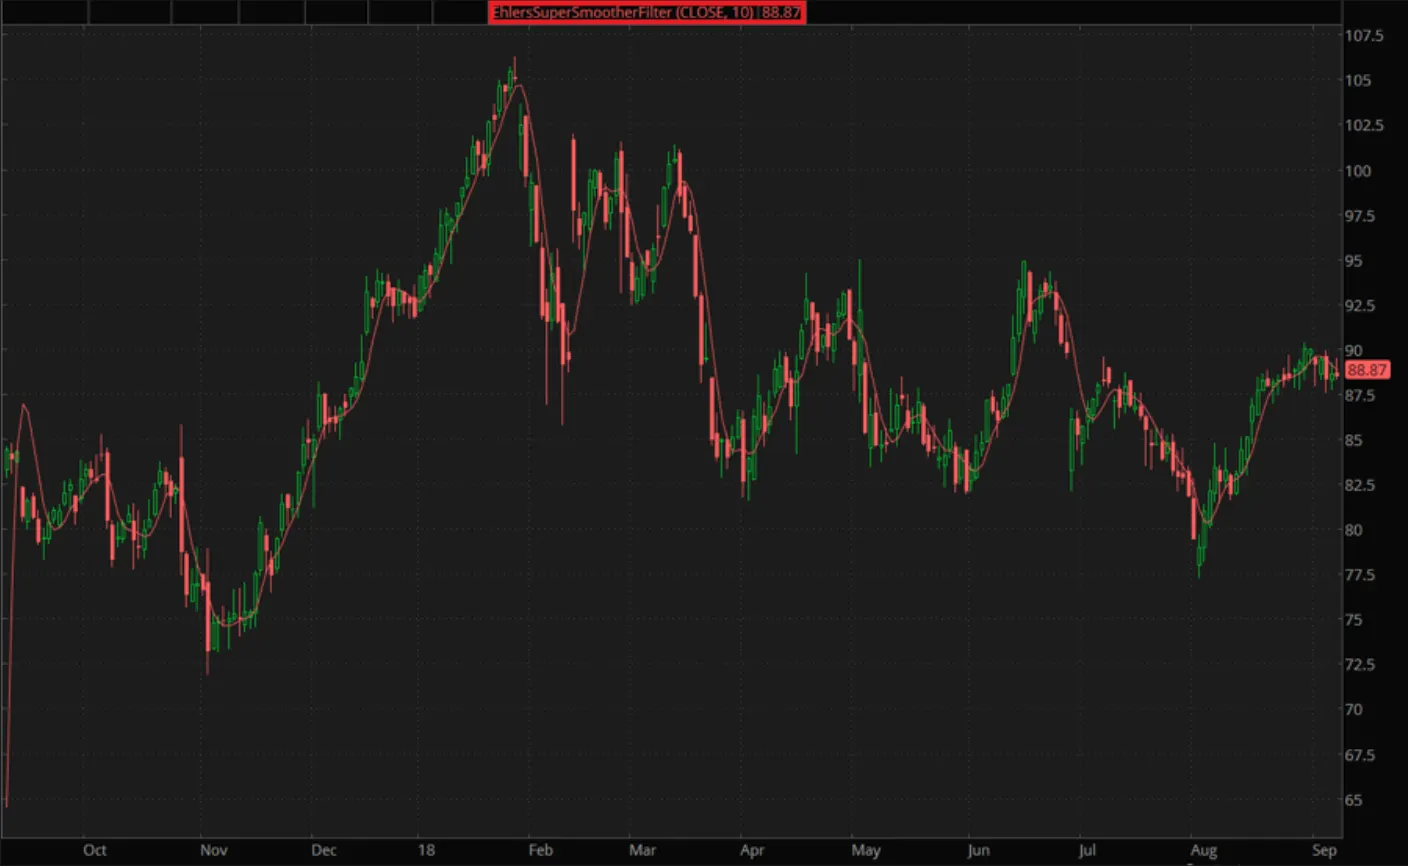
Ehlers' Super Smoother Filter
TL;DR: The Ehlers’ Super Smoother Filter is a smoothing technique that aims to reduce noise in price data.
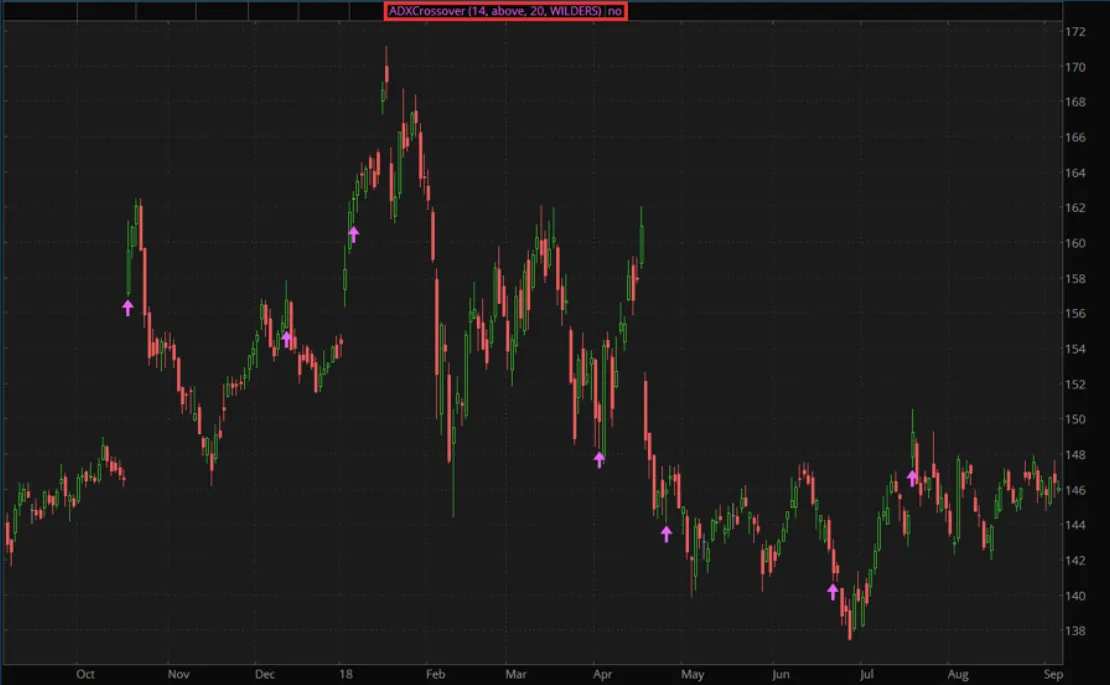
ADX Crossover Study
TL;DR: The ADX Crossover study finds where the ADX value crosses a specified level. When used alongside +DI and -DI crossover trade signals...
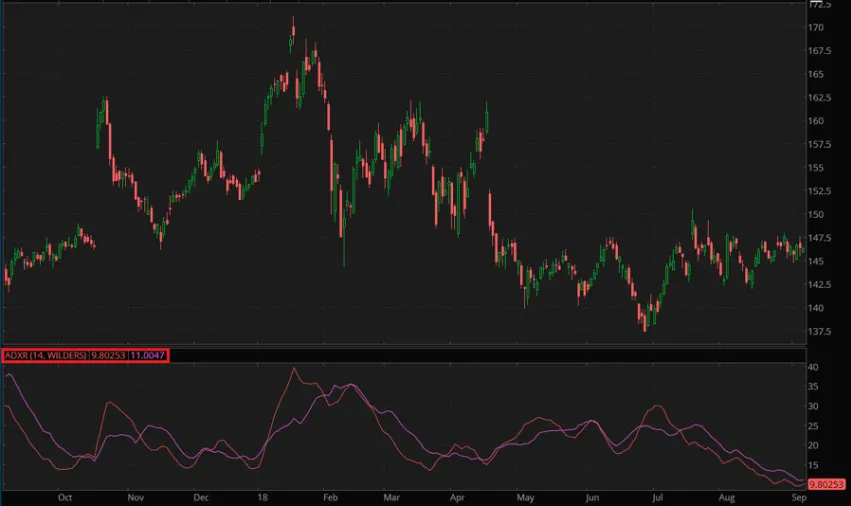
Average Directional Index Rating Study
TL;DR: The ADXR line measures the change in momentum in the ADX. It acts as the averaged ADX over a given period of time.
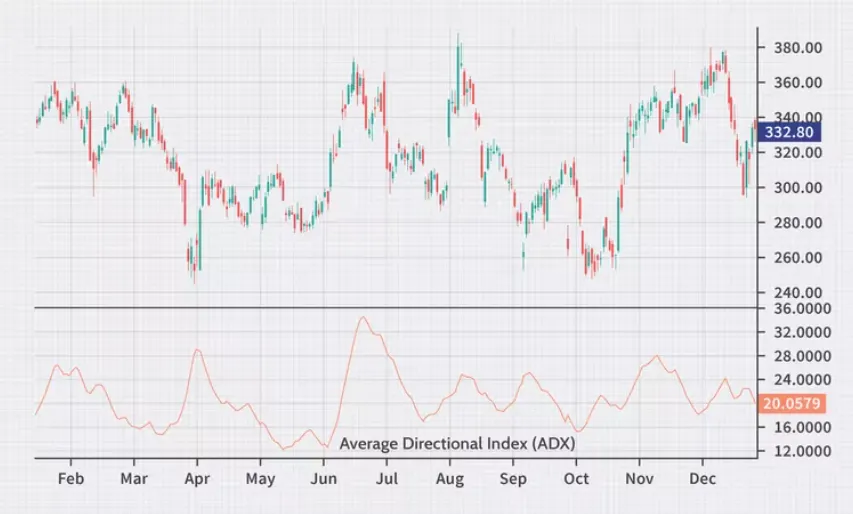
Average Directional Index (ADX) Study
TL;DR: The Average Directional Index (ADX) is calculated as the average of the values from the directional index. It’s used to assess overall trend strength.
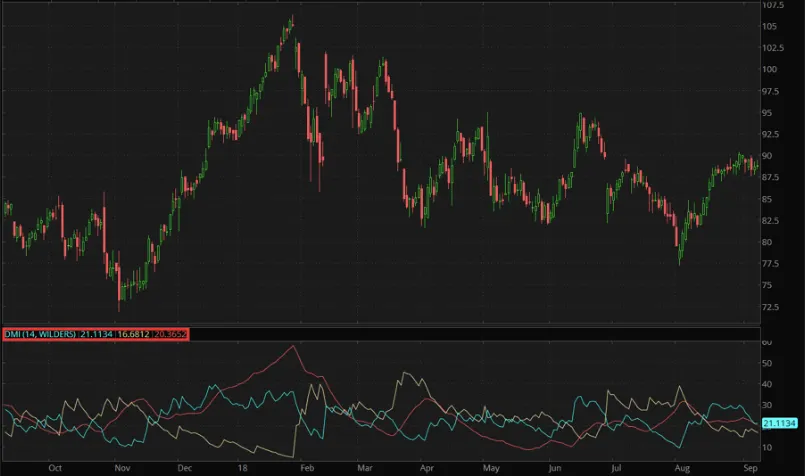
Directional Movement Index (DMI) Study
TL;DR: The Directional Movement Index indicates trend direction and strength by comparing prior highs (+DI) and prior lows (-DI) over a period of time. Trades signals...
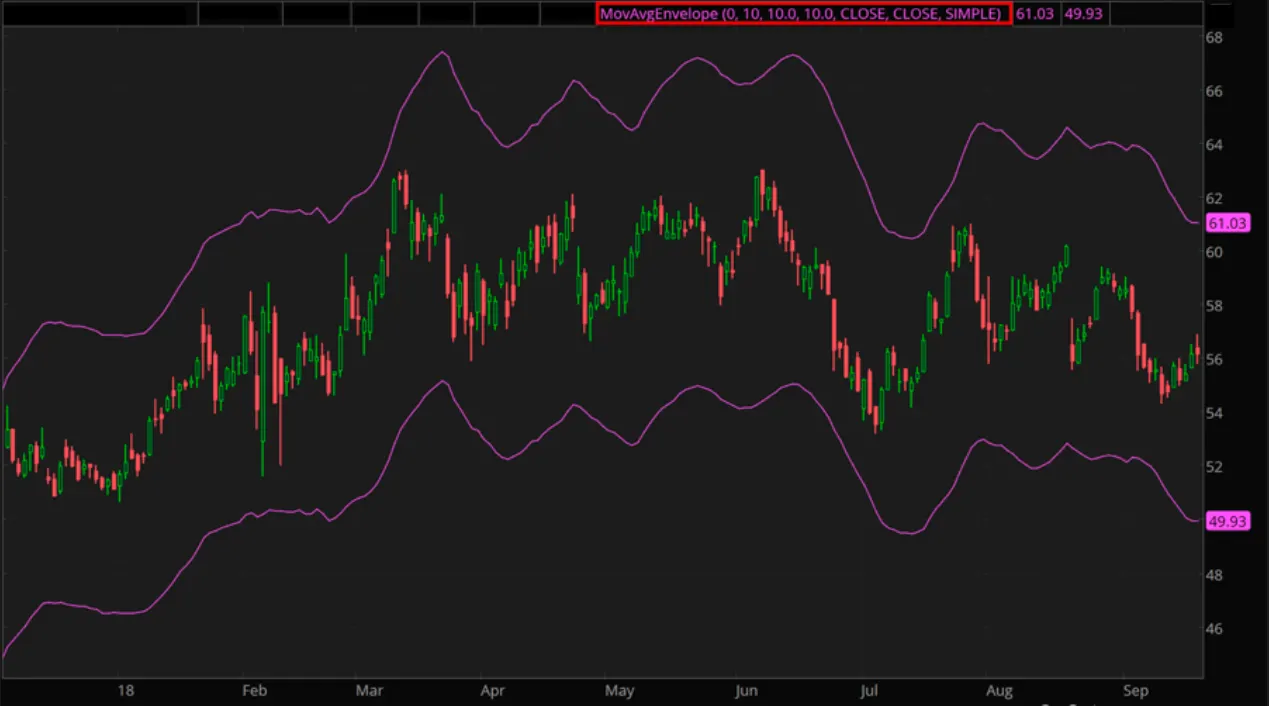
Moving Average Envelope (MAE) Study
TL;DR: Moving Average Envelopes are two lines plotted a certain percentage above and below the moving average of security...
Exponential Moving Average Ribbon (EMA Ribbon)
TL;DR: The EMA Ribbon study consists of 8 Exponential Moving Average plots of different lengths that form a “ribbon”. Crossovers of the moving averages indicate buy or sell signals.
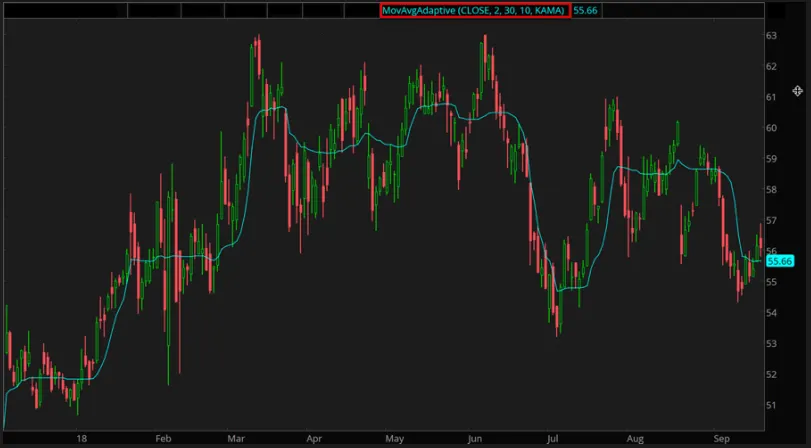
Adaptive Moving Average Study
The Adaptive Moving Average (AMA) study is a moving average that changes sensitivity based on the calculated volatility of a security.

Moving Average Two Lines Strategy
TL;DR: The Two Line Moving Average strategy plots two moving averages of different lengths to provide investors with trade signals based on crossover points.
Moving Average Bandwidth Study
The Moving Average Band Width indicator is based on the Moving Average Bands study. Instead of examining the interaction of the lines...
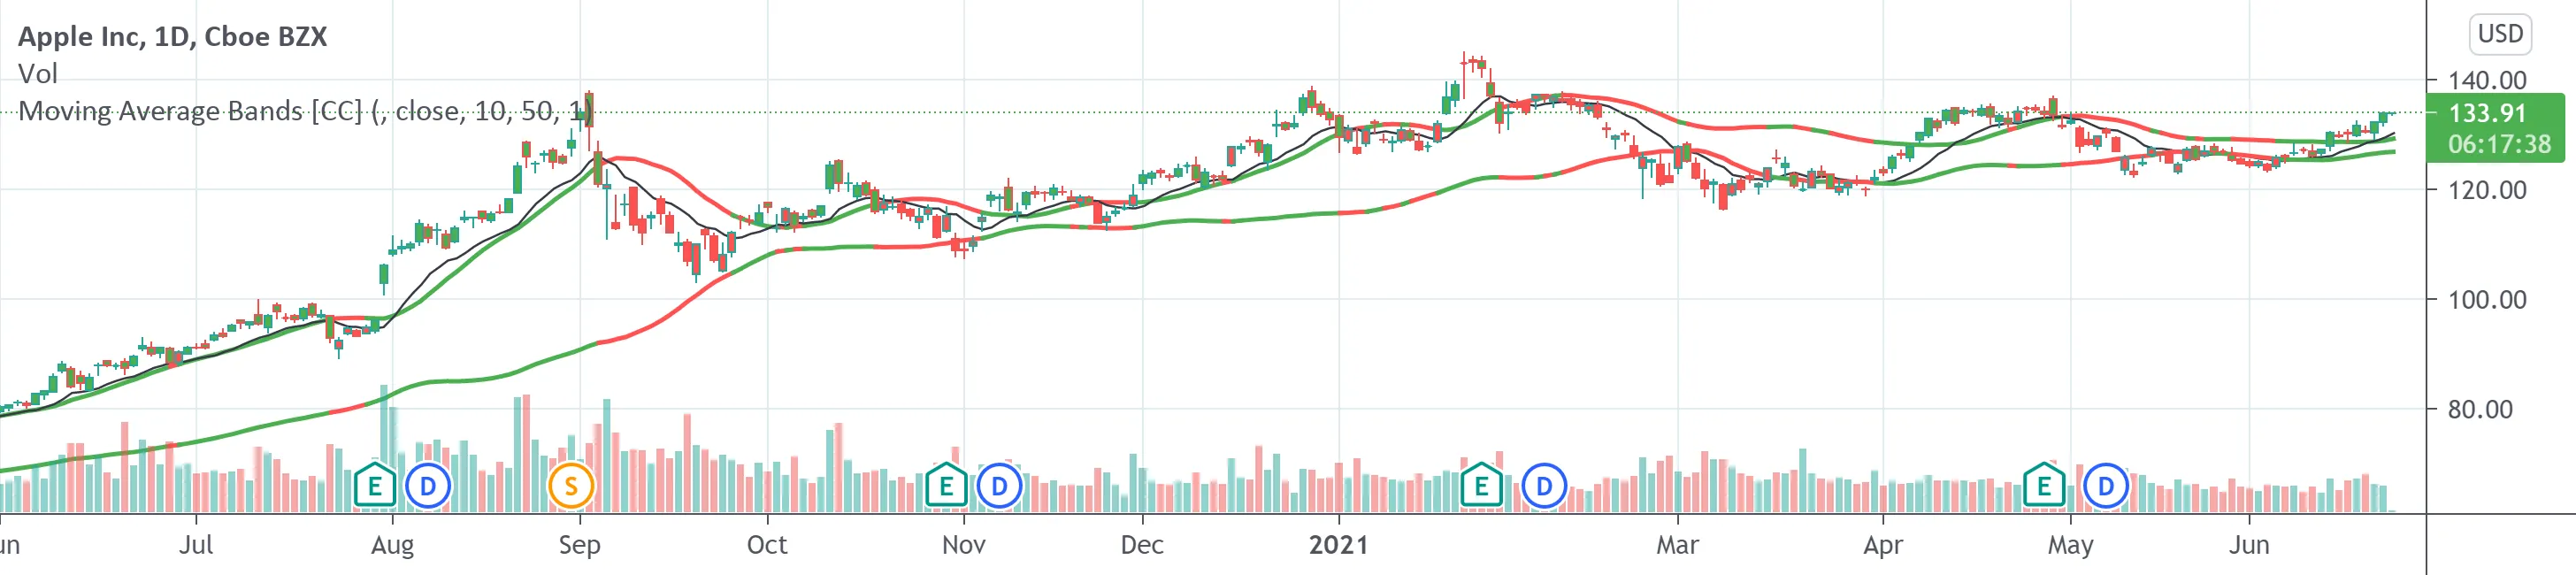
Moving Average Bands
TL;DR: Moving Average Bands are a technical indicator that plots four lines: two different moving averages and one upper and lower band based on their standard deviation.
Triangular Moving Average Study
TL;DR: The Triangular Moving Average is a variation of the moving average strategy that calculates the double-smoothed Simple Moving Average. This is otherwise known as the average of the average.
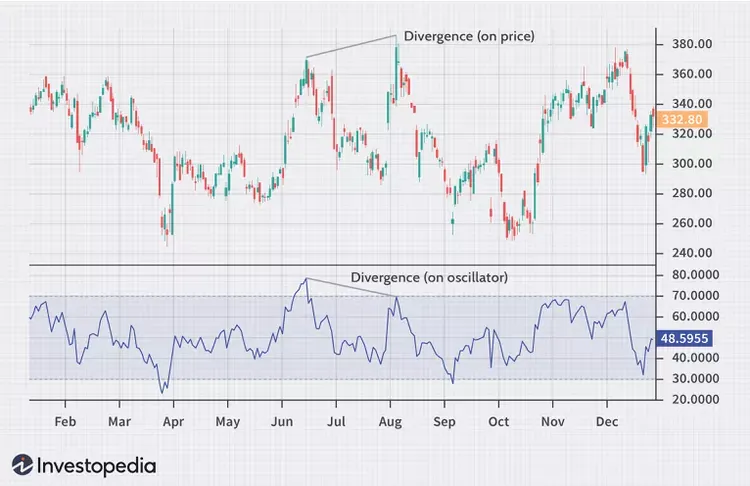
What is Divergence?
TL;DR: Divergence happens when the current price and the technical indicator of your choosing are heading in opposite directions. It tells you that the current trend is...
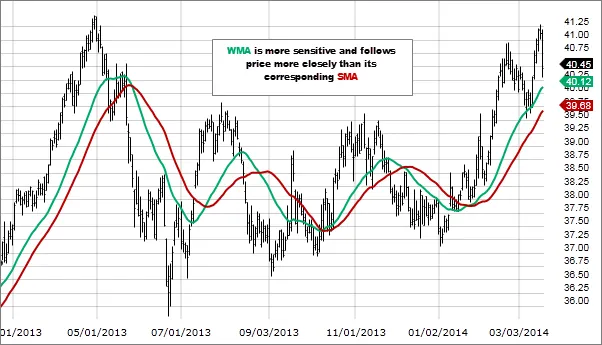
Weighted Moving Average (WMA) Study
TL;DR: The weighted moving average is a variation of the moving average strategy that places a greater weight on more recent price data. This helps...
Two Line Moving Average Study
TL;DR: The two line moving average study uses two moving averages of different lengths to determine buy and sell triggers for a given security.
Moving Average Crossover Study
TL;DR: Moving Average Crossover is a technical indicator that occurs when two moving averages of varying lengths cross over one another.
Hull Moving Average Study
TL;DR: The hull moving average strategy is a moving average indicator that eliminates the lag effect.
Bollinger Bands Crossover Study
TL;DR: Bollinger bands crossover shows the points in which price moves outside of bollinger bands. Price movement outside of bollinger bands is highly indicative of a bullish or bearish trend.
Bollinger Bands Long Entry Strategy
The bollinger bands long entry strategy is a method of...
Bollinger Bands Short Entry Strategy
The bollinger bands short entry strategy is a method of...
Wilder's Smoothing (Wilder's) Study
TL;DR: The Wilder's Smoothing (Wilders) is a type of moving average that assigns weights to price data (similar to Exponential Moving Average) which...
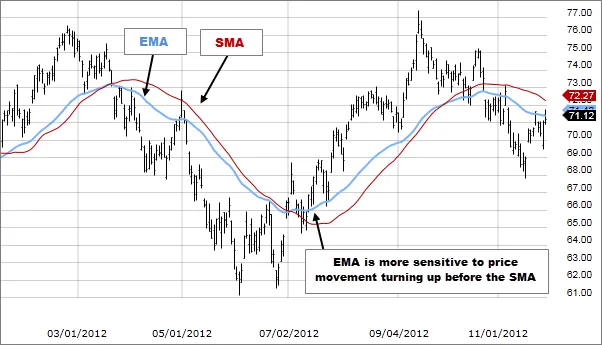
Exponential Moving Average (EMA) Strategy
TL;DR: The exponential moving average reacts quicker to current price changes than other moving average strategies because it places a greater weight on the most recent price data.
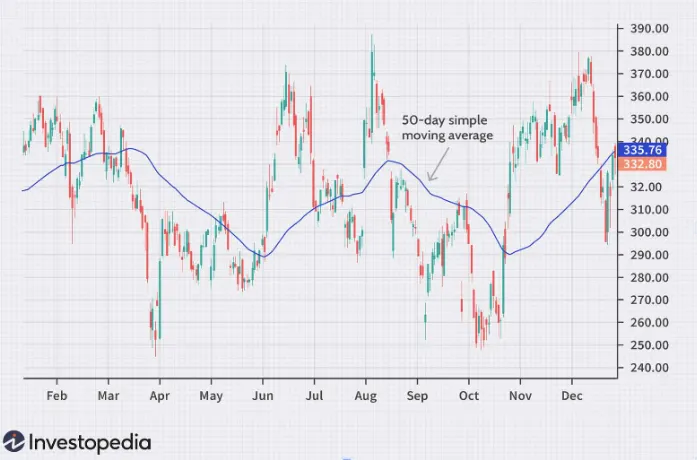
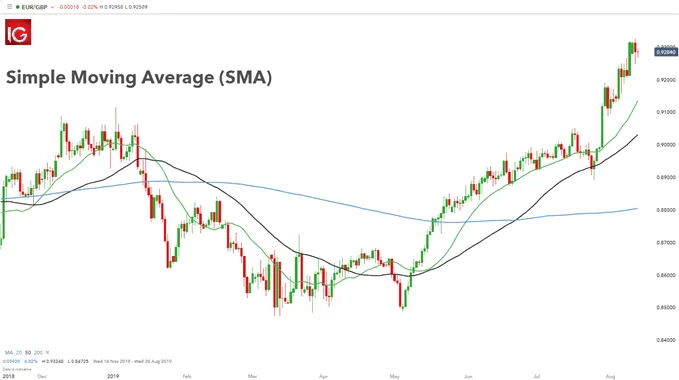
Simple Moving Average Study
TL;DR: The Simple Moving Average (SMA) is the average stock price over time which could be used as an indicator of a given security’s price trend.

Moving Average Strategy
TL;DR Moving averages are the average price of a security over a given number of days.

Acceleration Bands
Acceleration bands are a momentum based strategy, where the goal is to buy a security as price is rising and sell as the price peaks...

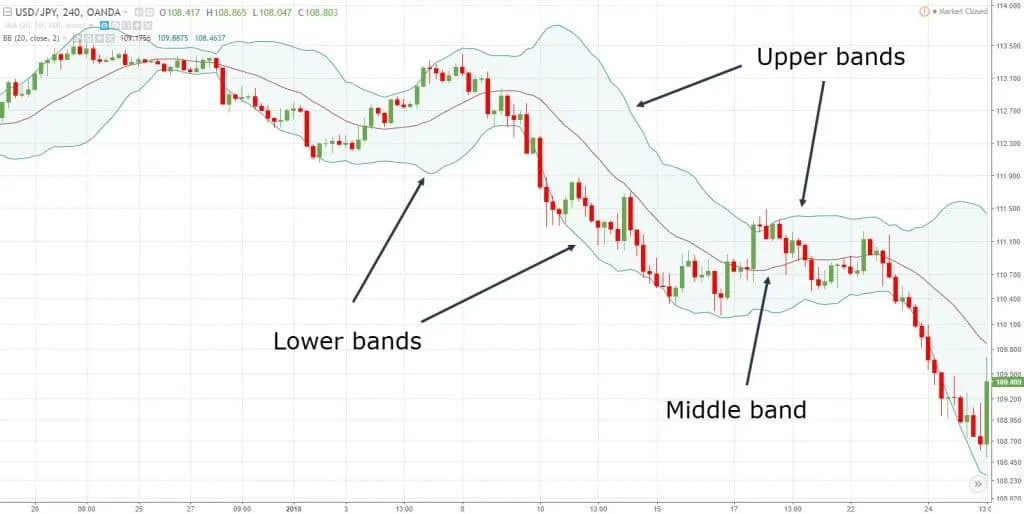
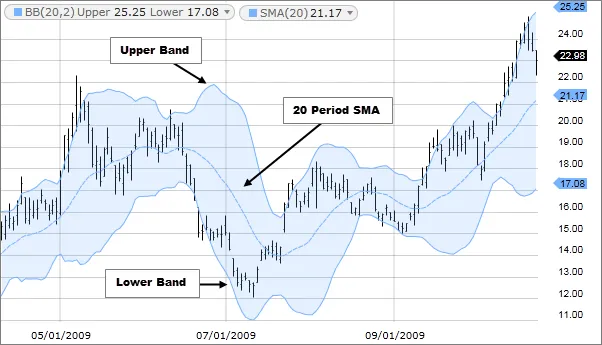
Bollinger Bands
TL;DR Bollinger bands are located two standard deviations above and below a moving average. When a security's price falls outside of the bollinger bands...
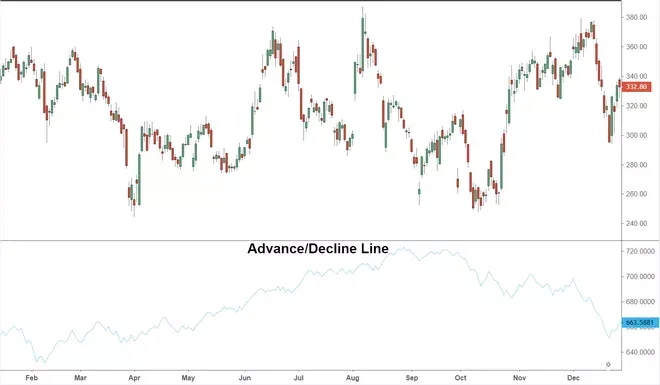
Advance Decline Cumulative Line Strategy
TL;DR: The advance decline line is an investment strategy that plots the number of increasing stocks to the number of decreasing stocks. It is a trend indicator.
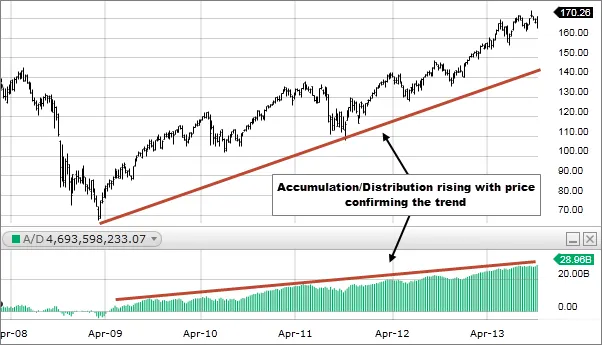
Accumulation Distribution Study
TL;DR: The Accumulation Distribution study evaluates the cumulative money-volume flow of a security.

Accumulation Distribution Strategy (A/D Strategy)
TL;DR: The A/D strategy uses the supply and demand of a security to determine how you should trade.