
Acceleration Bands
By Samantha Baltodano
TL;DR
Acceleration bands are a momentum based strategy, where the goal is to buy a security as price is rising and sell as the price peaks. Use a moving average strategy and bollinger bands to identify points of acceleration. These will be your signals to buy and sell.
What Are Acceleration Bands?
Acceleration bands are a technical indicator that help you define trends and measure the volatility of a security.
Think of this strategy as an extension of bollinger bands. If you haven't already, I recommend you read that article first.
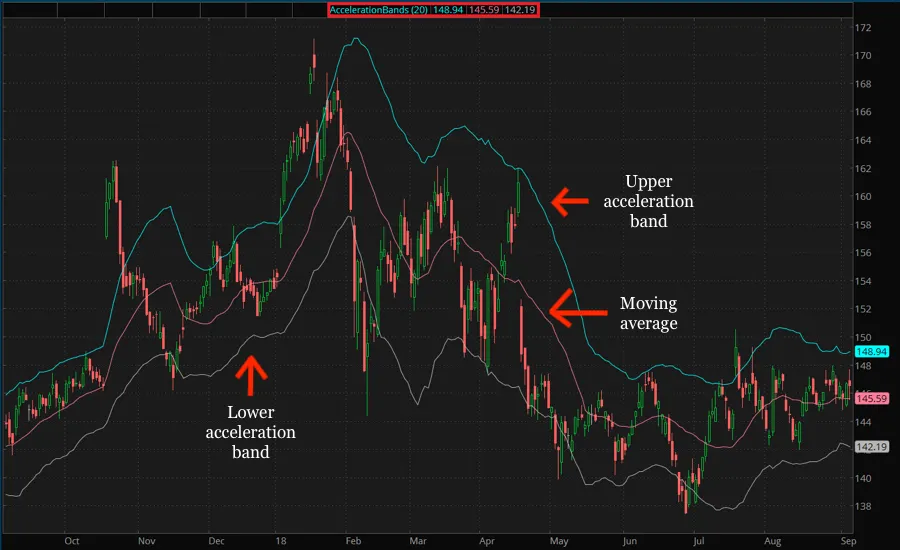
Source: thinkorswim Learning Center
Figure 1: Upper and lower acceleration bands and a moving average indicator.
Like bollinger bands, you’ll plot that same moving average envelope. This consists of an upper band, a lower band, and a moving average indicator (as seen in Figure 1).
Fix the upper and lower acceleration bands two standard deviations from a historical moving average.
Choose a moving average that meets your risk needs. Investors tend to prefer the exponential moving average for acceleration bands. This is because it’s more sensitive to recent price changes.
Why are these upper and lower bands significant?
The space between the upper and lower bands encompasses 95% of price action for a security. The more volatile a security is, the bigger the distance between the upper and lower bands.
The other 5% of price action that falls outside of these bands is when price really moves, these are the big trends. Those 5% of trends are what you want to trade because it’s when the stock is moving fastest in a bull trend or a bear trend.The goal is to get the maximum move in the shortest amount of time. There’s bigger opportunities when things break out of support and resistance. This is what separates acceleration bands from bollinger bands, you’re only trading the biggest moves.
So, when do you buy and sell?
Acceleration bands is a momentum-based strategy. This means that the goal is to buy a security as it’s rising and sell it once it’s reached its peak.
Wait until you see two consecutive closes outside of the acceleration bands. Two consecutive closes outside of the upper band indicates acceleration.
Buy when price breaks the upper acceleration band because acceleration is beginning. When price falls back within the bollinger bands, then acceleration has ended. This is a signal to sell.

Source: Trader Strategies (2015)
Figure 2: Upper acceleration band entry and exit points.
What else should you know?
It’s very important if you’re using this strategy to incorporate a trailing stop loss. A trailing stop will minimize your losses in the case that you respond to a false signal.
False signal example:
- Security X has 2 consecutive closes above the upper acceleration band
- A signal is set off to buy Y shares of stock X
- In the following days, price starts to rapidly decline back to within the bounds of the acceleration bands
Summary & Best Practices
- Acceleration bands expand on the bollinger band strategy. The difference is you’re only moving for the big trends, known as the points of acceleration.
- Most investors who use acceleration bands prefer the exponential moving average. This is because it places a greater weight on more recent closing prices.
- Acceleration bands are often used in options trading.
- Acceleration bands work best on growth stocks - stocks increasing by 20% or more annually.
- Always incorporate a trailing stop to minimize your losses in the case of a false signal.
Still want more info? Check out this video by BigTrends, the original creators of the acceleration bands strategy: How-To: Acceleration Bands Indicator.
Acceleration Bands is one of many strategies that Archaide automates. For a full list of strategies and studies available click here.
Like what you read? Check out the rest of our content!


