
Bollinger Bands
By Samantha Baltodano
TL;DR
Bollinger bands are located two standard deviations above and below a moving average. When a security's price falls outside of the bollinger bands, this is an indicator it is being oversold or overbought.
What Are Bollinger Bands?
Bollinger Bands are a technical indicator that help you define trends and measure the volatility of a security.

Source: Corporate Finance Institute (2022)
Figure 1: Upper and lower bollinger bands
It measures the volatility of returns using a historical moving average. An example of this would be the 10-day simple moving average.
Calculate the upper and lower bands in Figure 1 using the standard deviation from a moving average. The standard deviation is a statistic used in probability to test volatility. Plot the bollinger bands two standard deviations above and below the moving average.
What’s the significance of plotting the bollinger bands in this way?
- 95% of the historical price movement falls within the upper and lower bands.
- Because of this, it’s very unlikely that the closing price of a security will rise above or fall below the bands
- Using probability theory, price will likely revert back to the moving average or mean. This is mean reversion.
How do you identify entry and exit points using bollinger bands?
Entry points:
- Buy when a security’s close price falls below the lower band.
- Some investors wait for price to close back above the lower bollinger band before buying. This is a form of confirmation when applying mean reversion strategy
- Reversion of the mean is complete when a security rises back to its moving average.
Exit points:
- Some investors will sell when the security reaches the moving average
- Others will use the upper band as a target exit point
- This will have a bigger profit target, but takes longer to achieve.
- You might wait for confirmation by allowing the price to rise above the upper band, then close just below the upper band again.
- This is the idea that a break back into the bands will be a reversion back to the mean.
With this in mind, bollinger bands can either trend upward or downward. Some investors will only buy when the bollinger bands are trending upward. They’ll completely ignore entry points when bollinger bands are on a downward trend, as shown in Figure 2. Timing entry and exit based on this is an added benefit to bollinger bands.
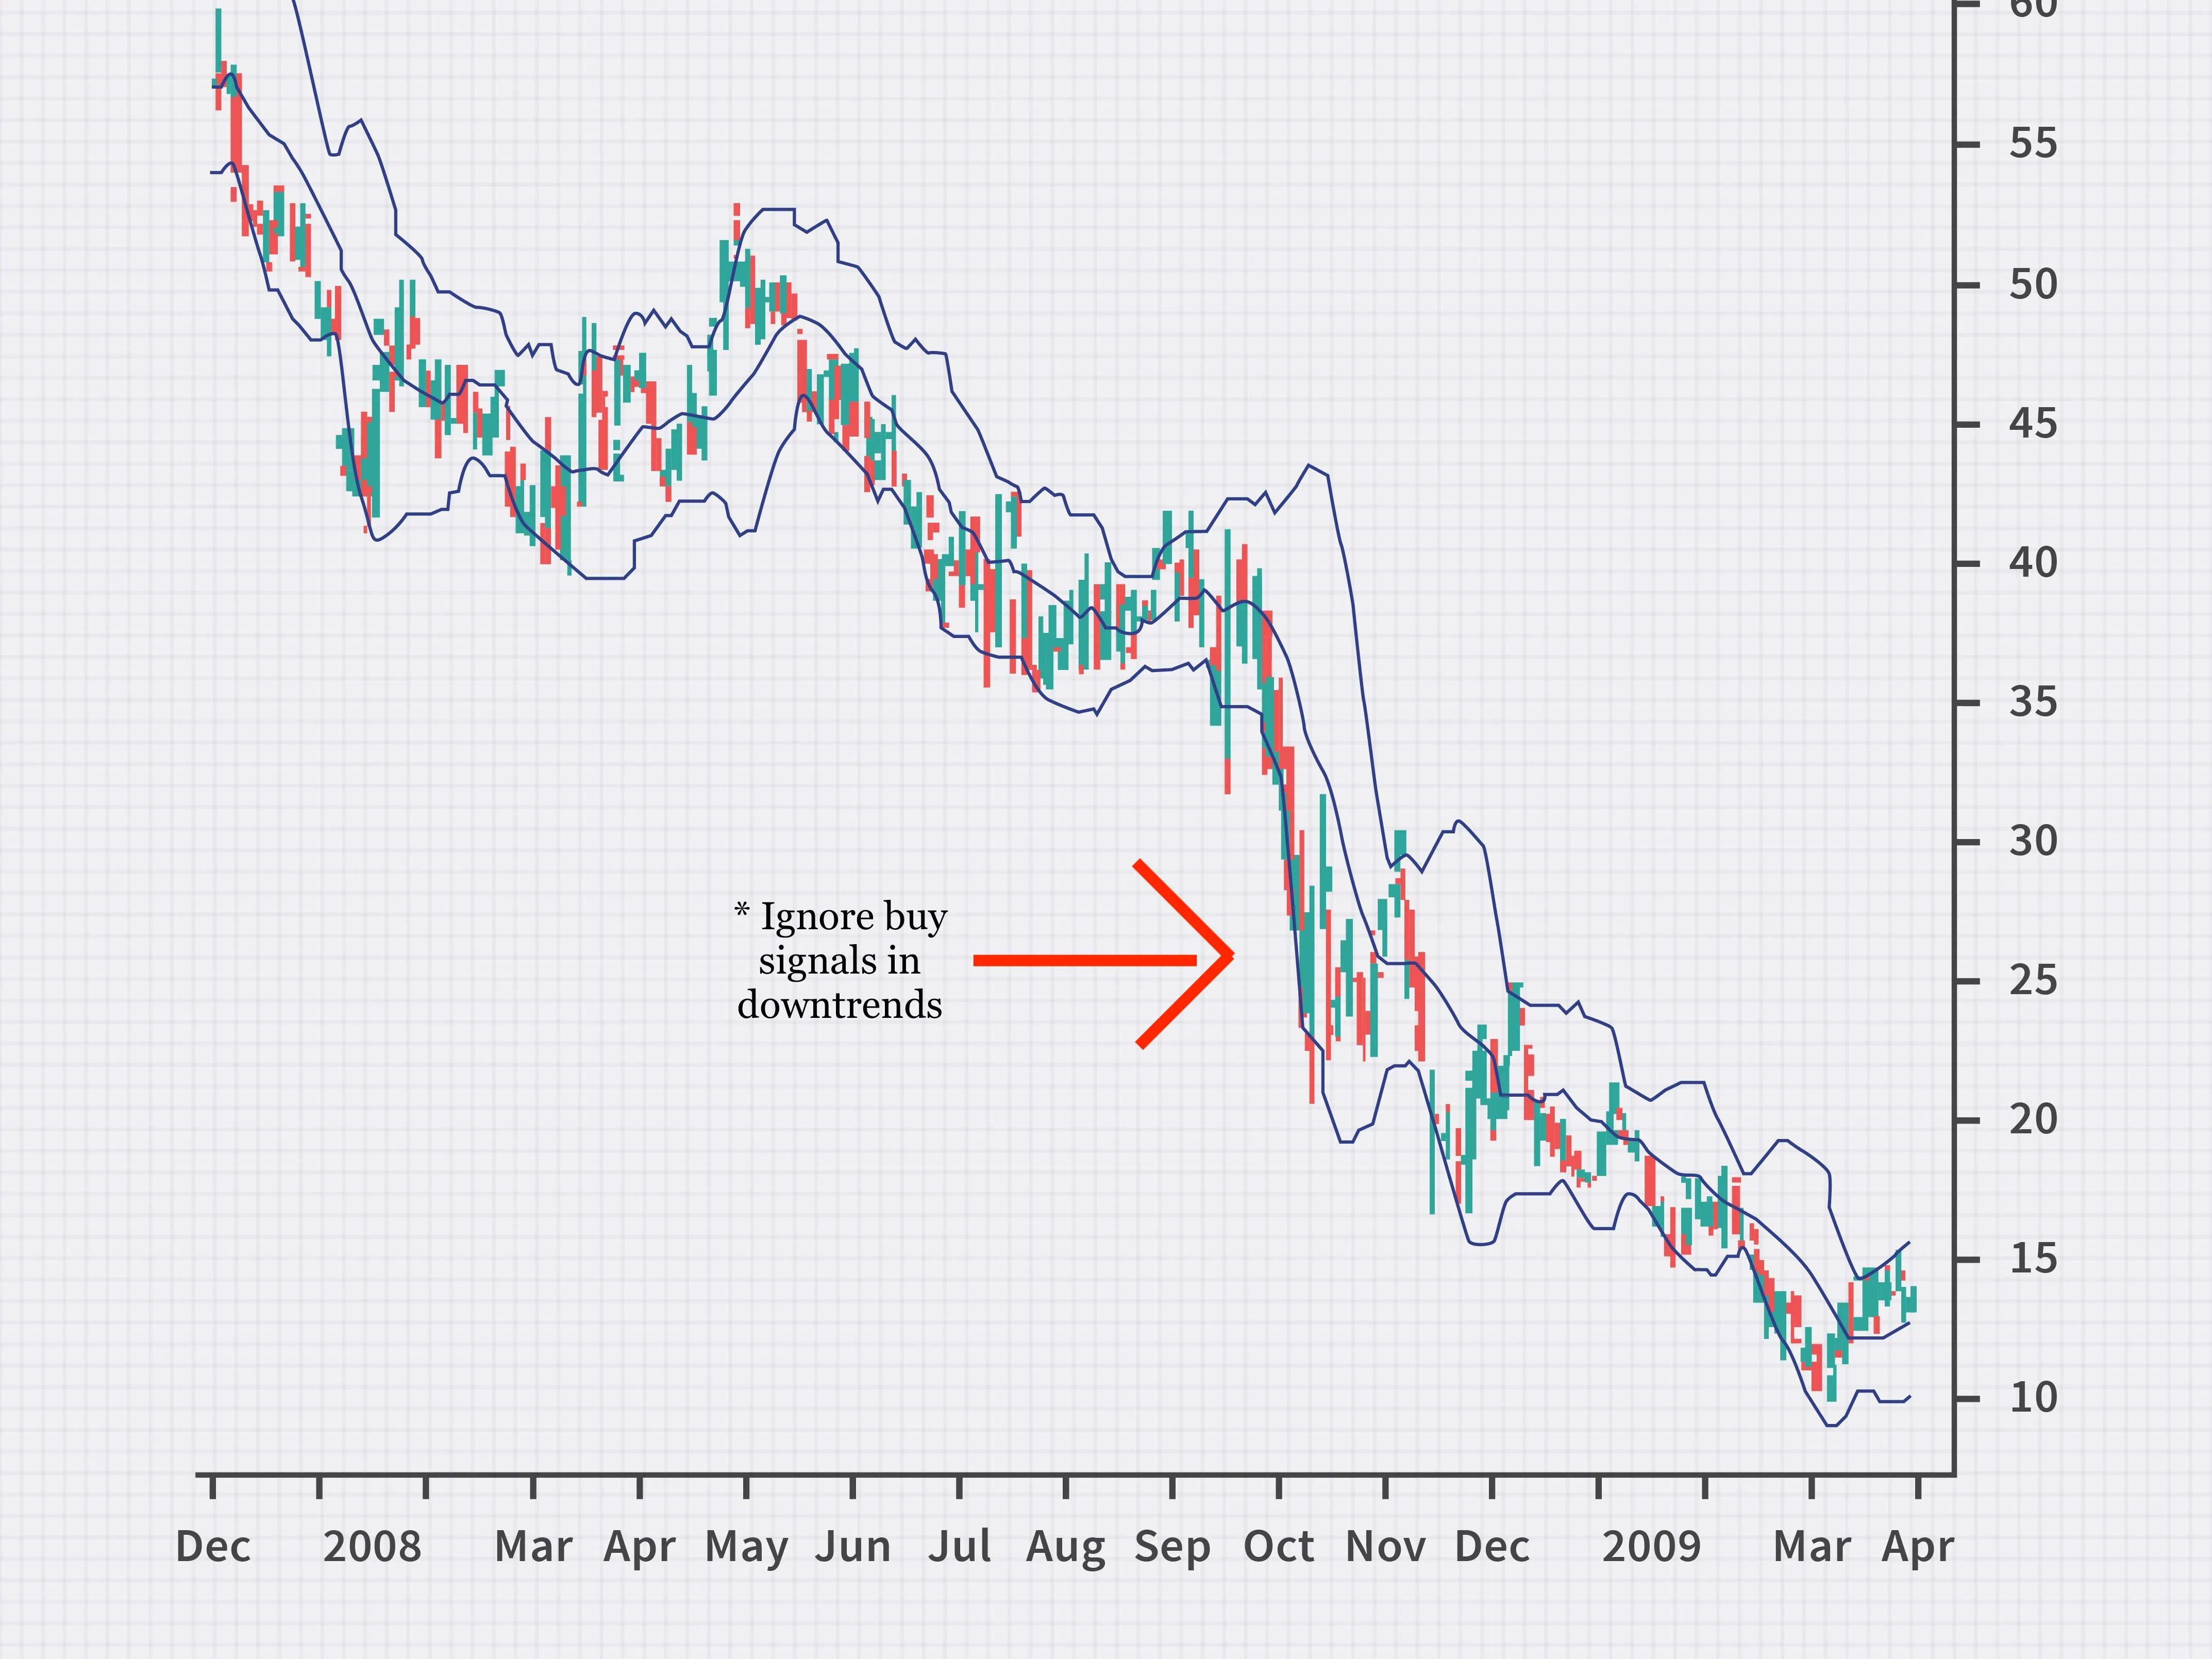
Source: Investopedia (2022)
Figure 2: Buy triggers are ignored when the stock is in a downtrend
Summary
- Bollinger bands by default are plotted two standard deviations from the moving average. This means that the space within the two bands accounts for 95% of price action.
- Bollinger bands are not meant to be used on their own. Couple them with an existing indicator to confirm trends. The default is the 20 day simple moving average.
- Bollinger bands add context to trends to explain when they may be overextended and reversed.
- There are different strategies for buying with bollinger bands. Generally, if the price falls below the lower band, then buy. If the price moves above the moving average or the upper band, then sell. This allows you to buy cheap and sell high.
Bollinger Bands is one of many strategies that Archaide automates. For a full list of strategies and studies available click here.
Like what you read? Check out the rest of our content!


