Triple Exponential Moving Average (TEMA) Study
By Samantha Baltodano
TL;DR:
The Triple Exponential Moving Average (TEMA) is an indicator designed to smooth price fluctuations and help identify trends. It takes multiple exponential moving averages of the original EMA and subtracts out some of the lag.
The TEMA can be used to identify trend direction and signal potential short-term trend changes or pullbacks. The TEMA reacts quicker to price changes than traditional MAs but still has some lag.
The location of the TEMA relative to the price can also help confirm trend direction, and crossover signals may be used to aid in entering or exiting positions.
A lookback period must be chosen to determine the TEMA's effectiveness in identifying trends.
What Is The Triple Exponential Moving Average?
The Triple Exponential Moving Average (TEMA) was designed to smooth price fluctuations, thereby making it easier to identify trends without the lag associated with traditional moving averages (MA).
It does this by taking multiple exponential moving averages (EMA) of the original EMA and subtracting out some of the lag.
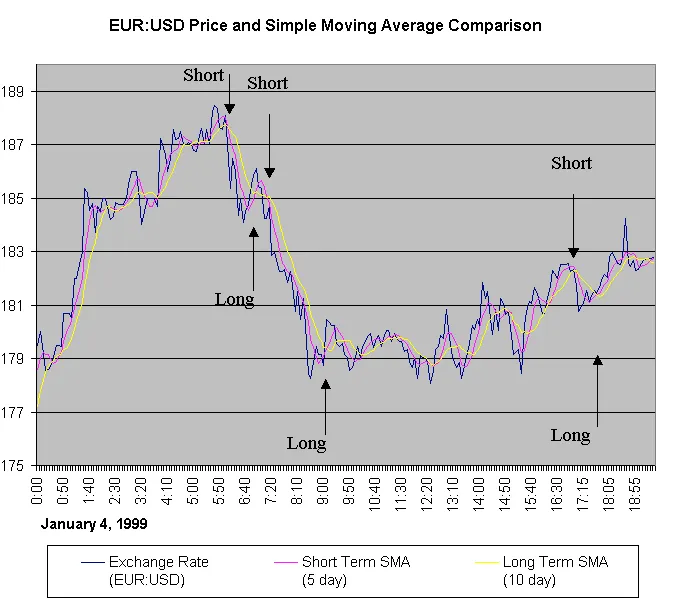
The TEMA is used like other MAs. It can help identify trend direction, signal potential short-term trend changes or pullbacks, and provide support or resistance. The TEMA can be compared with the double exponential moving average (DEMA).
Formula and Calculation for the TEMA
Triple Exponential Moving Average (TEMA)
TEMA = (3∗EMA1) - (3∗EMA2) + EMA3
where:
EMA1 =Exponential Moving Average (EMA)
EMA2 = EMA of EMA1
EMA3 = EMA of EMA2
- Choose a lookback period. This is how many periods will be factored into the first EMA. With a fewer number of periods, such as 10, the EMA will track price closely and highlight short-term trends. With a larger lookback period, such as 100, the EMA will not track price as closely and will highlight the longer-term trend.
- Calculate the EMA for the lookback period. This is EMA1.
- Calculate the EMA of EMA1, using the same lookback period. For example, if using 15 periods for EMA1, use 15 in this step as well. This is EMA2.
- Calculate the EMA of EMA2, using the same lookback period as before.
- Plug EMA1, EMA2, and EMA3 into the TEMA formula to calculate the triple exponential moving average.
What Does the TEMA Tell You?
The TEMA reacts to price changes quicker than a traditional MA or EMA will. This is because some of the lag has been subtracted out in the calculation.
A TEMA can be used in the same ways as other types of MAs. Mainly, the direction the TEMA is angled indicates the short-term (averaged) price direction. When the line is sloping up, that means the price is moving up. When it is angled down, the price is moving down.
There is still a small amount of lag in the indicator, so when prices change quickly the indicator may not change its angle immediately.
Also, the larger the lookback period, the slower the TEMA will be in changing its angle when price changes direction. For example a 200-day TEMA will respond to price changes more slowly than a 9-day TEMA.
The TEMA and Trend Direction
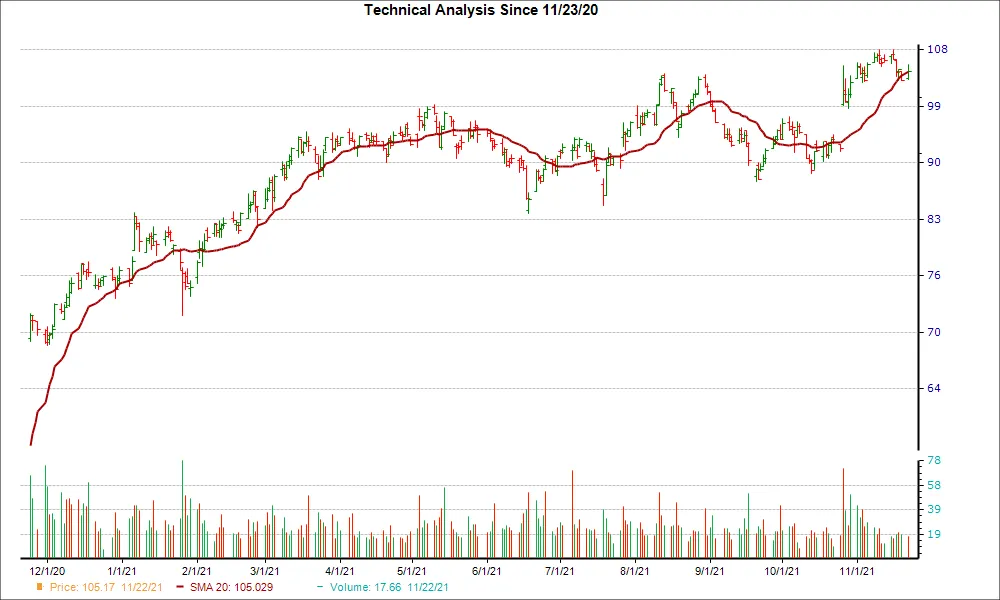
The location of the TEMA relative to the price also provides clues as to the trend direction.
Generally, when the price is above the TEMA it helps confirm the price is rising for that lookback period. When the price is below the TEMA, it helps confirm the price is falling for that lookback period.
That said, a lookback period should be chosen so this actually holds true most of the time. Therefore, it is up to the trader to choose the appropriate lookback period for the asset they are trading if they intend to use the TEMA for helping to identify trends.
If the TEMA can help identify trend direction, then it can also help identify trend changes.
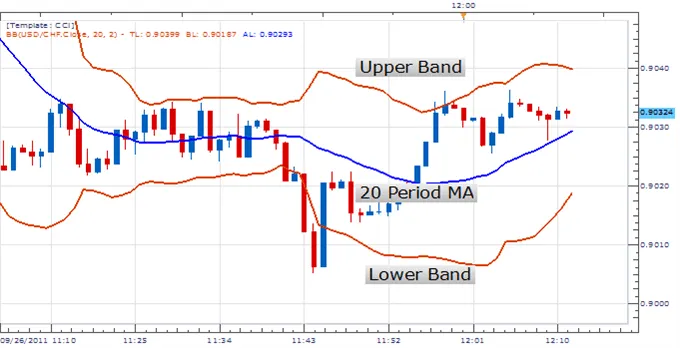
If the price is above the average, and then drops below, that could signal the uptrend is reversing, or at least that the price is entering a pullback phase. If the price is below the average, and then moves above it, that signals the price is rallying.
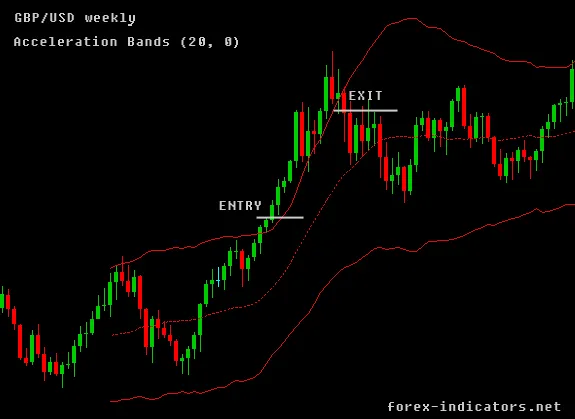
Such crossover signals may be used to aid in deciding whether to enter or exit positions.
Test The Triple Exponential Moving Average
Great news!
You can back test this exact strategy on historical data for any of your favorite symbols using TradingView.
This strategy has already been built and all you have to do is log in and take it for a spin. You can access this indicator here.
If you’re new to back testing and to TradingView, don’t worry. I created a step-by-step guide you can follow to begin testing the Triple Exponential Moving Average.
Summary
- The triple exponential moving average (TEMA) uses multiple EMA calculations and subtracts out the lag to create a trend following indicator that reacts quickly to price changes.
- The TEMA can help identify trend direction, signal potential short-term trend changes or pullbacks, and provide support or resistance.
- When the price is above the TEMA it helps confirm an uptrend; when the price is below the TEMA it helps confirm a downtrend.
Triple Exponential Moving Average is just one of many studies that Archaide automates. For a full list of strategies and studies available click here.
Like what you read? Check out the rest of our content!


