Accumulation Swing Index Study
By Samantha Baltodano
TL;DR:
The Accumulation Swing Index (ASI) is a technical indicator used to identify long-term trends in the stock market. It calculates whether the market is trending up, down, or sideways by analyzing the movement of a stock's price over time.
The ASI is a cumulative indicator that takes into account the entire price history of a stock and can be used in conjunction with other technical indicators.
The ASI is calculated using a formula that includes the Swing Index and a specified limit move that can be adjusted based on trader preferences and market volatility.
Traders can use the ASI to generate buy and sell signals based on trend direction, crossovers with moving averages, and divergences between the ASI and stock price.
You can access this indicator here.
What Is The Accumulation Swing Index Study?
The Accumulation Swing Index (ASI) is a technical indicator that helps traders identify long-term trends in the stock market.
By analyzing the movement of a stock's price over time, the ASI calculates whether the market is trending upwards, downwards, or sideways. It does this by using a combination of the Swing Index and a specified limit move, which controls the size of the ASI (more on this later).
One of the benefits of the ASI is that it's a cumulative indicator, which means that it takes into account the entire price history of a stock. This can be useful for identifying long-term trends that may not be obvious with other trading strategies.
The ASI can also be used alongside other trading strategies, like the moving averages and MACD, to generate more accurate signals and confirm trends.
Formula and Calculation
The ASI is calculated using the following formula:
- ASI = Prior ASI + Current Swing Index x Limit Move
The Swing Index is calculated using the following formula:
- SI = 50 x [(Current High - Prior Close) + 0.5 x (Current High - Current Low) + (Current Low - Prior Close)]
The ASI is a cumulative indicator, which means that the current ASI value is based on the previous day's ASI value.
The Limit Move is a predetermined value that is used to control the size of the ASI. The default value for the Limit Move is 1.0, but it can be adjusted to fit the trader's preferences.
Adjusting Your Limit Move
The Limit Move value determines the sensitivity of the ASI indicator to price changes, and a higher Limit Move will lead to a slower response to price changes and a smoother ASI curve, while a lower Limit Move will lead to a more sensitive ASI and a choppier curve.
If a trader is looking for a long-term trend, they may want to use a higher Limit Move value to filter out short-term price changes and focus on the overall trend.
However, if a trader is interested in short-term trades, a lower Limit Move value might be more appropriate to capture those short-term price fluctuations.
Traders should also consider the volatility of the market when adjusting the Limit Move.
If the market is highly volatile, a higher Limit Move might be appropriate to avoid false signals, while in a low volatility market, a lower Limit Move might be needed to capture price movements.
Trade Signals using the Accumulation Swing Index
Traders use the ASI to identify long-term trends in the market and to generate buy and sell signals.
Let’s dive into how to interpret and trade with the ASI indicator…
When the ASI is positive, it indicates a long-term uptrend, and when it is negative, it indicates a long-term downtrend. Traders can use the ASI to identify when the trend is changing direction.
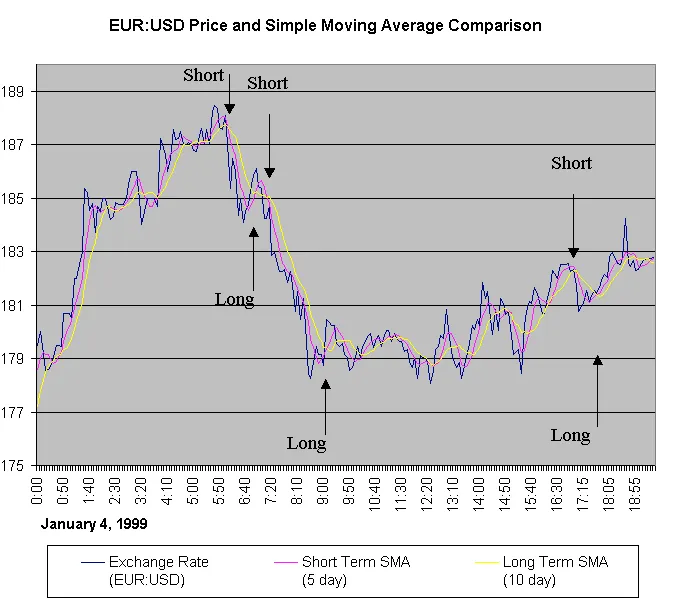
One common signal is the crossover of the ASI and the moving average of the stock.
- When the ASI crosses above the moving average, it could be a signal to buy,
- and when it crosses below the moving average, it could be a signal to sell.
Another signal is the divergence between the ASI and the price of the stock. If the ASI is trending higher, but the price of the stock is trending lower, it could be a signal that the trend is weakening and a reversal could be imminent.
Test The Accumulation Swing Index Study
Great news!
You can back test this exact strategy on historical data for any of your favorite symbols using TradingView.
This strategy has already been built and all you have to do is log in and take it for a spin. You can access this indicator here.
If you’re new to back testing and to TradingView, don’t worry. I created a step-by-step guide you can follow to begin testing the Accumulation Swing Index Study.
Summary
- The ASI is a technical indicator used to identify long-term trends in the stock market.
- It calculates whether the market is trending up, down, or sideways by analyzing the movement of a stock's price over time.
- The ASI is a cumulative indicator that takes into account the entire price history of a stock and can be used in conjunction with other technical indicators.
- The ASI is calculated using a formula that includes the Swing Index and a specified limit move that can be adjusted based on trader preferences and market volatility.
- Traders can use the ASI to generate buy and sell signals based on trend direction, crossovers with moving averages, and divergences between the ASI and stock price.
Accumulation Swing Index is just one of many studies that Archaide automates. For a full list of strategies and studies available click here.
Like what you read? Check out the rest of our content!


