Bollinger Bands Divergence Study
By Samantha Baltodano
TL;DR:
The Bollinger Bands Divergence is a technical indicator that measures how much a stock or other asset is moving differently than a related market, like the overall stock market. It uses Bollinger Bands, to compare how much the asset is moving compared to the market. If the divergence is big enough, it can be a sign that the stock's price might change soon
What Is the Bollinger Bands Divergence Study?
The Bollinger Bands Divergence is a technical indicator that measures divergence between a security and a related market. In other words, it measures how much a stock or other asset is moving differently than a related market, like the overall stock market.
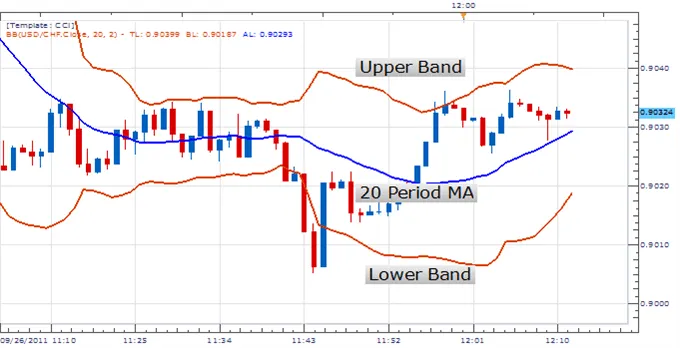
It uses Bollinger Bands, which plots three lines - a Moving Average and an upper and lower standard deviation around the Moving Average - that show how much an asset's price has been moving recently, to compare how much the asset is moving compared to the market.
The Bollinger Bands Divergence study estimates the divergence between two financial instruments using the following algorithm:
- The relative position within the Bollinger Bands is calculated for both primary (i.e. the security) and secondary symbols (i.e. the related market).
- The divergence is calculated as the percentage difference between these two positions.
- The divergence is then analyzed in relation to two predefined levels, usually placed above and below the zero line.
Trading signals are determined based on the behavior of the divergence plot; these signals are used in the Bollinger Bands Divergence strategy after confirmation by other technical indicators.
If the divergence is big enough, it can be a sign that the stock's price might change soon. A buy signal is suggested when the divergence rises above the upper level (set by default at 20%) and then starts declining. Vice versa, it might be interpreted as a sell signal when having fallen below the bottom level (-20% by default), the divergence reverses its direction.
Summary
- Bollinger Bands Divergence is an indicator that measures the divergence between a security and a related market
- It uses Bollinger Bands to compare the relative position of the security to the market
- Trading signals are determined based on the behavior of the divergence plot; these signals are used in the Bollinger Bands Divergence strategy after confirmation by other technical indicators.
BB Divergence is just one of many studies that Archaide automates. For a full list of strategies and studies available click here.
Like what you read? Check out the rest of our content!


